Example:
• Click on the Example button on the Statlets window at the end of this page. Note how the data has been entered. The data consists of measurements on strength.
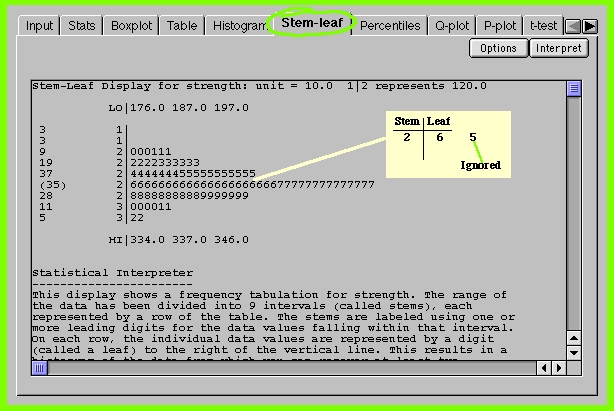
• Click on Stem-leaf, you will see the following window
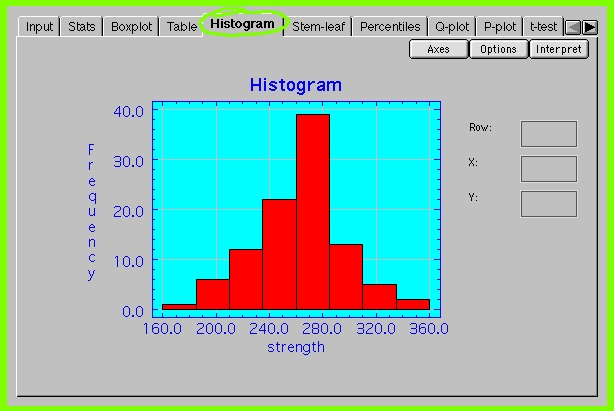
• Click on Histogram, you will see the following window
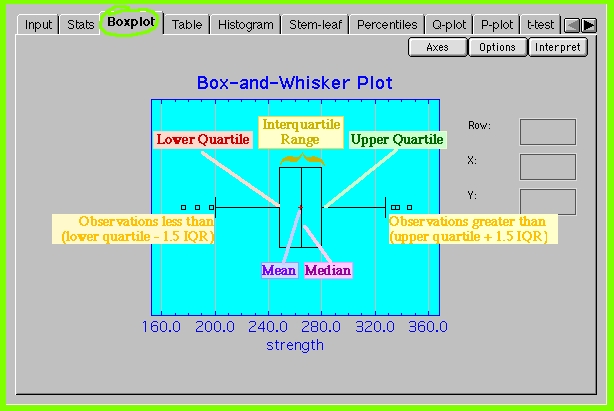
• Click on Boxplot, you will see the following window
Learning Check:
The data that will pop up when you click on
 gives the exam scores of 40 students
in sociology, music, and physics courses.
gives the exam scores of 40 students
in sociology, music, and physics courses.
• Enter the data for only sociology exam scores.
• Produce stem-and-leaf display, histogram, and boxplot.
• Interpret the output. What type of differences and similarities do you see between these plots?