Example:
• Click on the Example button on the Statlets window at the end of this page. Note how the data has been entered. There are five variables in this data
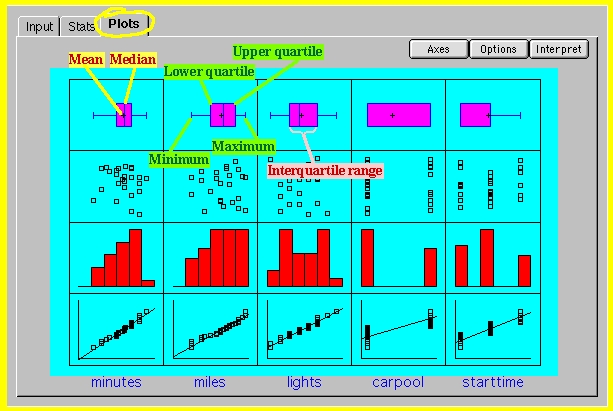
• Click on Plots, you will see the following window
Statlets will allow you to calculate various grahical displays of the data. To see these options
• Click on the Options button on the upper right corner of the Statlets window at the end of this page.
• Click on Plots, you will see the following window
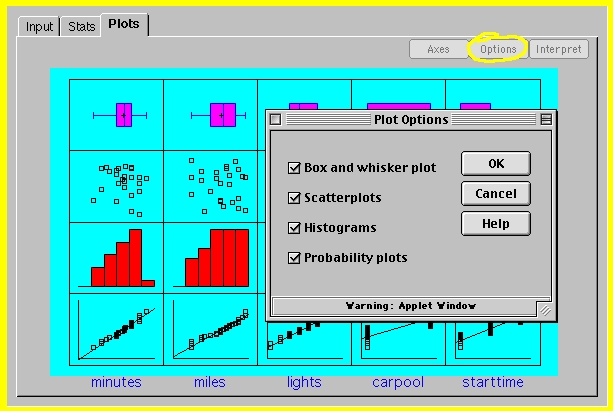
• Select the graphical displays that you would like to construct.
Learning Check:
The data that will pop up when you click on
 gives the exam scores of 40 students
in sociology, music, and physics courses.
gives the exam scores of 40 students
in sociology, music, and physics courses.
• Enter the data.
• Click on the Plots.
• Interpret the output. What type of differences do you see between courses? Does the mean provide you information on these differences?