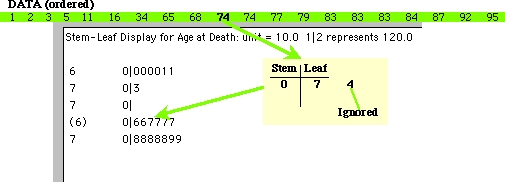
The data used in the following displays is age at death of members of a
family in a burial ground.
- Analyze each graph and make sure that you understand how each one of
them is constructed.
- Compare each one of these displays and
discuss
which one one them is more meaningful graphical representation of the
data.


