Pareto analysis seeks to discover from an analysis of defect reports or customer complaints which "vital few" causes are responsible for most of the reported problems. The old adage states that 80% of reported problems can usually be traced to 20% of the various underlying causes. By concentrating your efforts on rectifying the vital 20%, you can have the greatest immediate impact on product quality.
This statlet performs a Pareto analysis given a set of defect types and frequencies of occurrence. It constructs a frequency table and two types of Pareto charts. The tabs are:
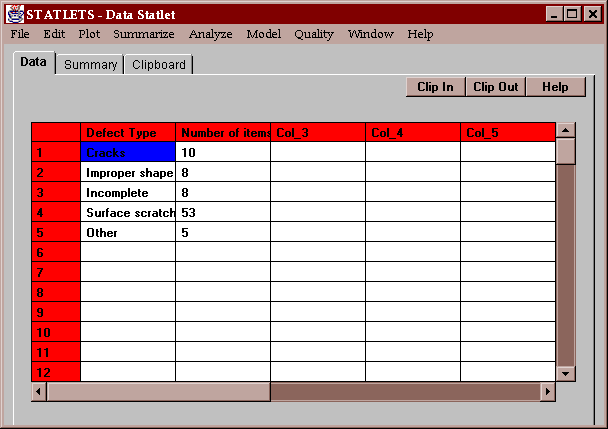
The sample data consists of information about 84 defective items returned to a supplier. The items have been classified by their defect type:

Two columns must be input, one containing labels for each defect type and the second containing counts:
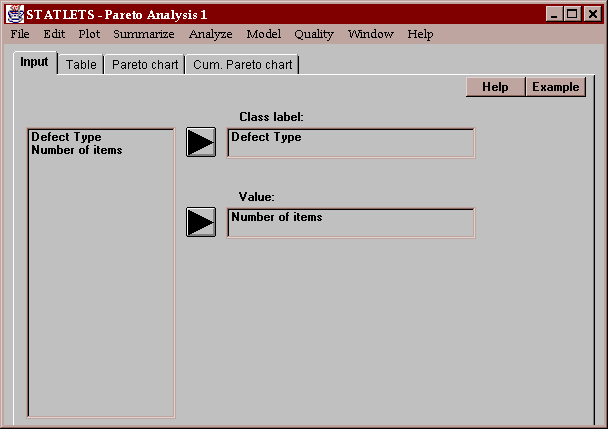
The counts must be integers and non-negative.
This tab creates a table showing each type of defect from the most common through the least common:
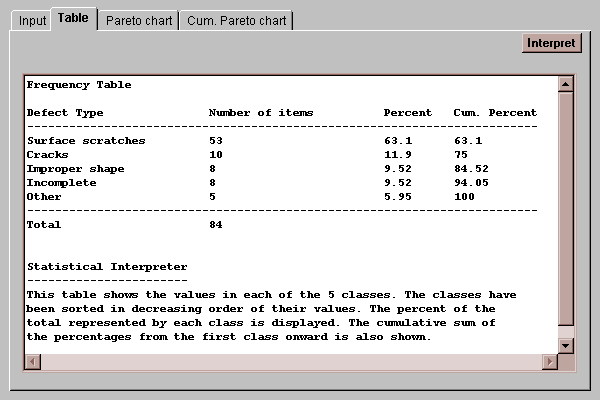
The number of items of each type is shown, together with their percentages of the total. The rightmost column lists the cumulative percentages, which show the percentage represented by each class or classes higher on the list.
The Pareto chart draws bars with height proportional to the percentage represented by each defect type:
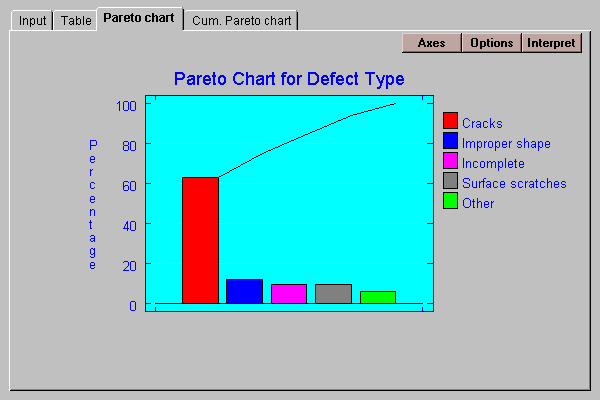
As in the table, the types are sorted in decreasing order of frequency. The solid line above the bars shows the cumulative percentages.
The Options button allows you to change the format of the chart:
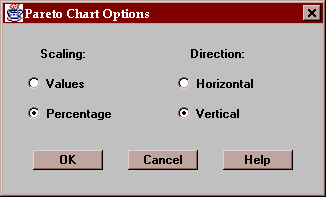
You may specify:
Scaling - whether to scale the axis according to the values (frequencies of occurrence) or the percentages.
Direction - the direction of orientation for the bars.
This tab shows a slightly different format for the Pareto chart:
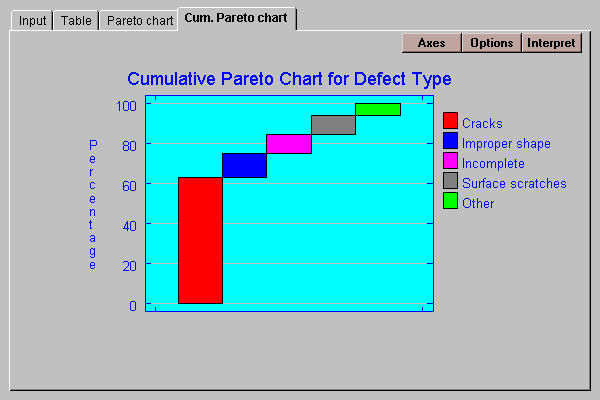
The bars are stacked so that the tops of the bars show the cumulative percentages.
The Options button allows you to change various aspects of the plot. It is identical to that shown in the previous section.