This statlet determines the required sample size for comparing the parameters of two binomial distributions. The tabs are:
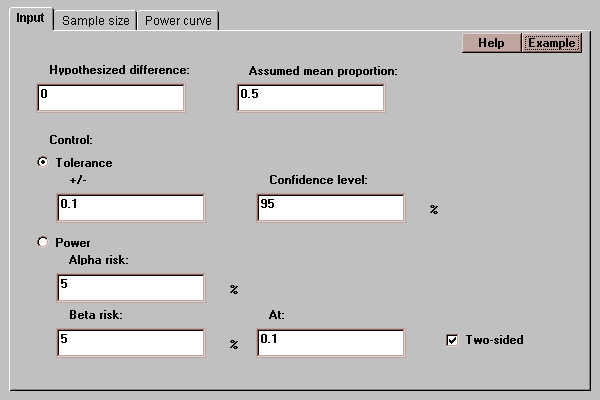
The input tab permits you to specify information about the estimation or test you wish to perform:

Enter:
Hypothesized difference - the hypothesized value of the difference between the population proportions specified by the null hypothesis.
Assumed mean proportion - the average proportion of the two populations. If not known, use 0.5 to be conservative.
Tolerance - if selected, the sample size necessary to achieve a confidence interval of the specified width will be determined.
Power - if selected, the sample size necessary to achieve a test with the indicated power will be determined. Specify the probability of a Type I error (alpha), the probability of a Type II error (beta), and the alternative at which the power will be controlled. If the desired test is two-sided, be sure the checkbox labeled "Two-sided" is checked.
For more details on hypothesis tests, see the Glossary.
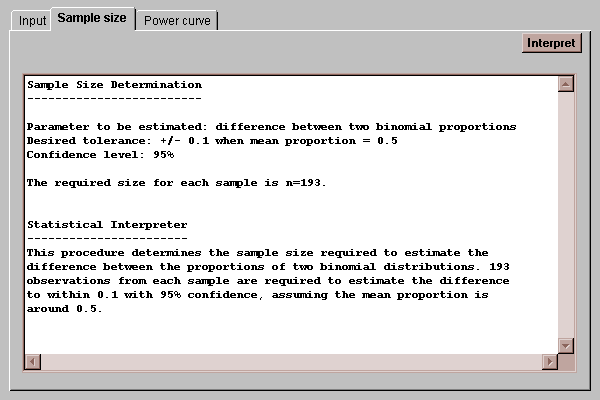
This tab shows the sample size needed to meet the requirements entered on the input panel:

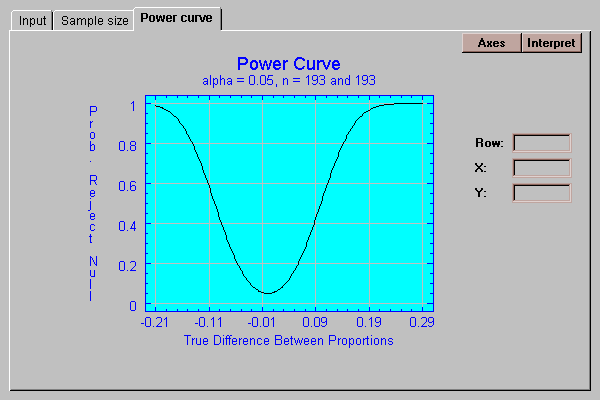
This tab shows the power curve for the determined sample size:

The power curve shows the probability of rejecting the null hypothesis as a function of the true difference between the population proportions.