This statlet tests hypotheses about the parameter of a binomial distribution. The tabs are:

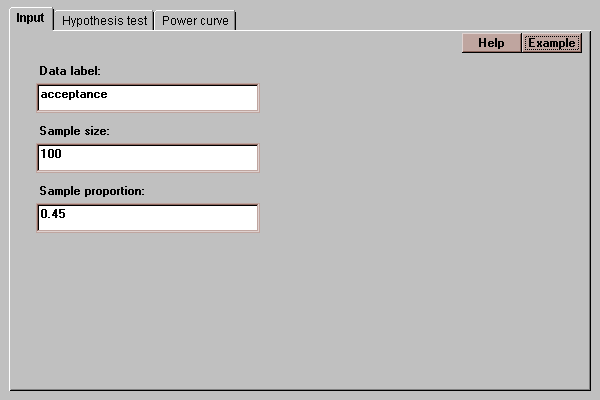
To use this statlet, enter the following information about your data:
Data label - a name to be displayed on the output.
Sample size - the size of the sample.
Sample proportion - the observed sample proportion.
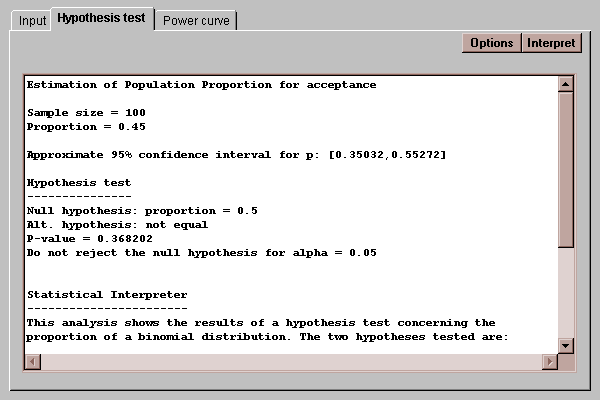
This tab shows the result of a hypothesis test concerning the population proportion:

It shows:
Summary statistics.
A confidence interval for the proportion.
The result of a hypothesis test run to test a hypothesis about the population proportion.
Use the Options button to specify the hypotheses to be tested. If the P-value is less than the alpha risk which you specify, you should reject the null hypothesis at the corresponding significance level.

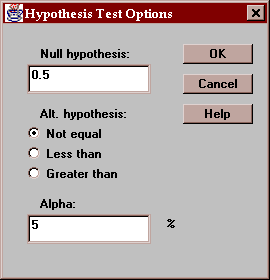
Enter:
Null hypothesis - the value of the proportion specified by the null hypothesis.
Alt. Hypothesis - select a two-sided test (~=) or a one-sided test.
Alpha - the probability of a Type I error, which is a situation where a true null hypothesis is incorrectly rejected. Typical values for alpha are 10%, 5%, and 1%. The confidence interval is also affected by this setting and uses a confidence level equal to (100-alpha)%.
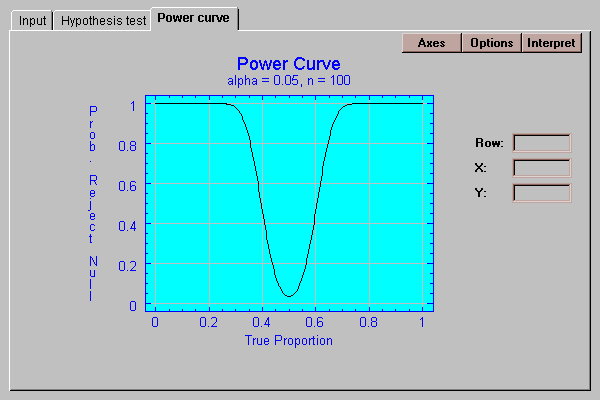
This tab shows the power curve for the hypothesis test:

The power curve shows the probability of rejecting the null hypothesis as a function of the true population proportion.
Same as previous tab.