This statlet calculates various probability distributions. It plots the probability density or mass function, the cumulative distribution function, the survivor function, the log survivor function, and the hazard function. It also computes tail areas and critical values. The tabs are:
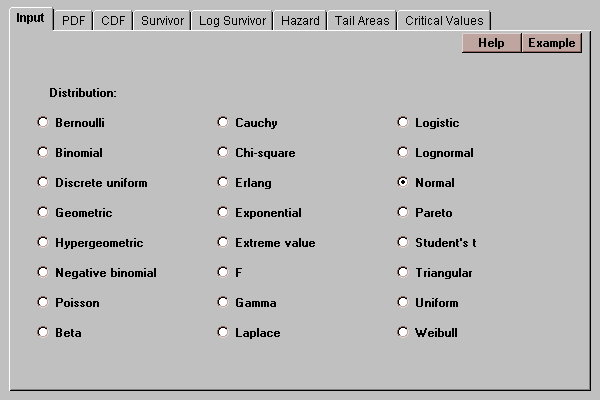
The initial tab allows you to select any of 24 different probability distributions:
The first 7 distributions are appropriate for discrete data (data which can take on only integer values). The others are appropriate for continuous data. Information about each distribution is given in the Glossary.
The distributions which are most appropriate for modeling measurement data are: exponential, extreme value, gamma, Laplace, logistic, lognormal, normal, Pareto, uniform, and Weibull.
This tab plots the probability density function (for continuous distributions) or the probability mass function (for discrete distributions):
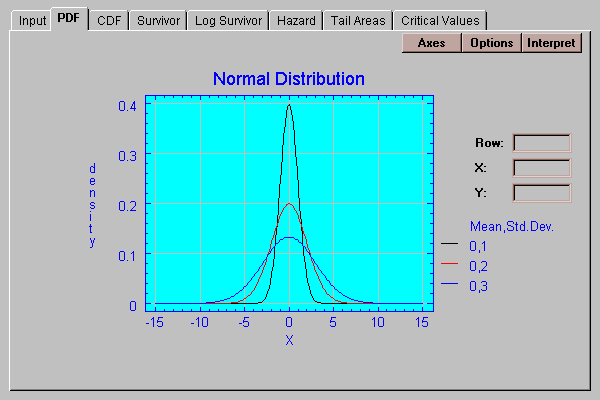
The distribution may be plotted for up to 5 different sets of parameters, specified by pressing the Options button.
This button displays a dialog box on which you may specify up to five sets of parameters:
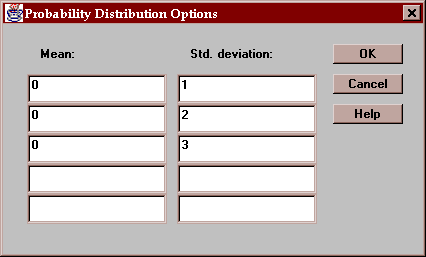
The parameters to be specified will depend on the selected distribution.
This tab plots the cumulative distribution:
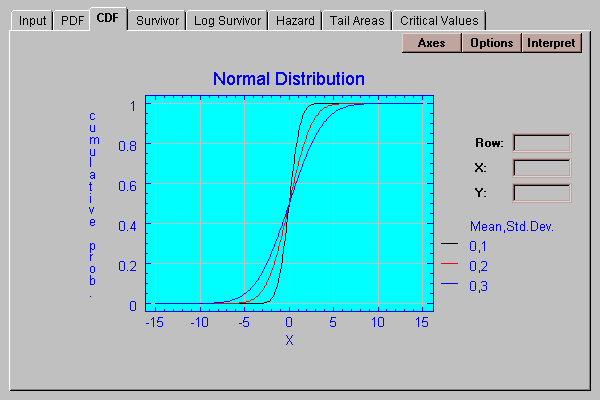
The cdf shows the probability of being less than or equal to X as a function of X.
This tab plots the survivor function:
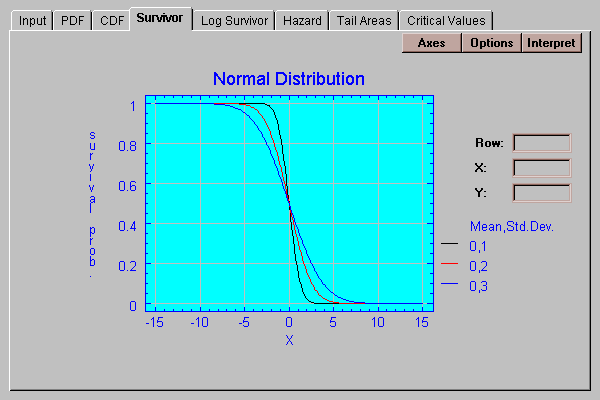
The survivor function shows the probability of being greater than X as a function of X.
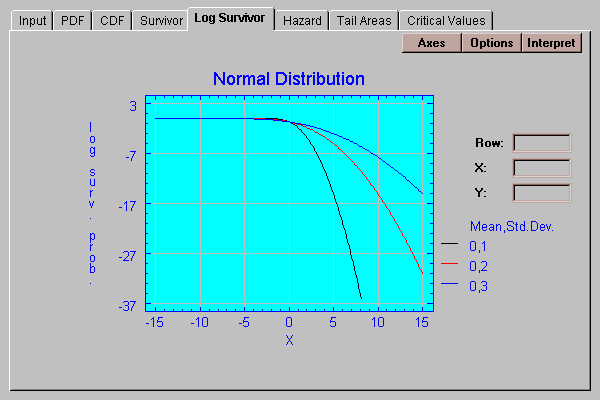
This tab plots the natural logarithm of the survivor function:
This tab plots the hazard function:
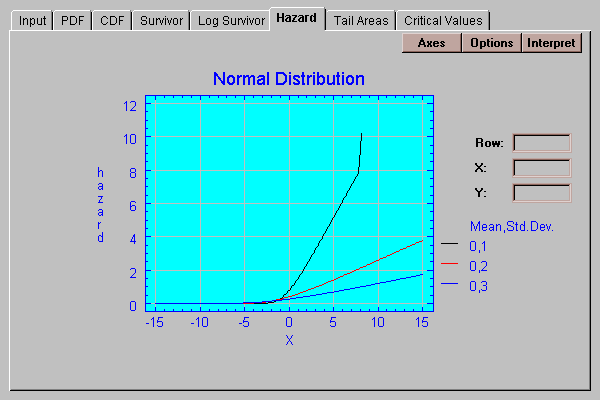
The hazard function equals the density function divided by the survivor function. It represents the conditional probability of obtaining a value in a small interval above X, conditional on the value being greater than X. In modeling failure time distributions, the hazard function describes the instantaneous failure rate.
This tab calculates probabilities for up to five values of X:
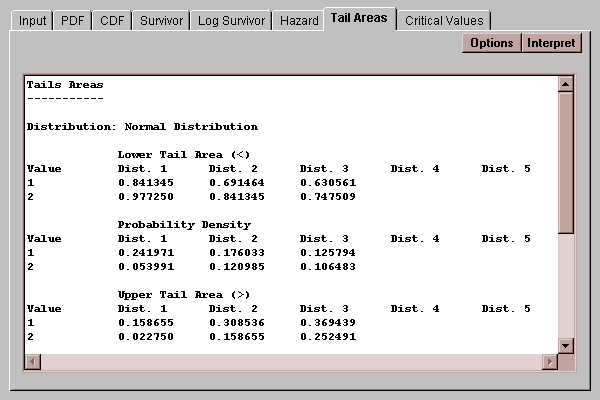
The table shows:
Lower Tail Area - the probability of being less than X.
Probability Density or Probability Mass - the value of the density function or mass function at X. For a discrete distribution, this represents the probability of being exactly equal to X.
Upper Tail Area - the probability of being greater than X.
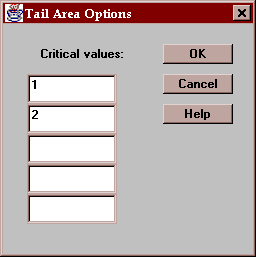
The values at which the probabilities are calculated are specified using the Options button.
Press this button to specify up to 5 values of X at which probabilities will be calculated:
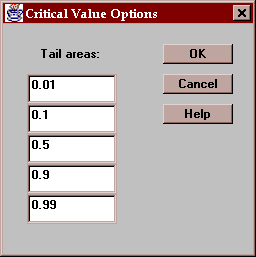
This tab finds values of X for which the probability of being less than or equal to X does not exceed specified values:
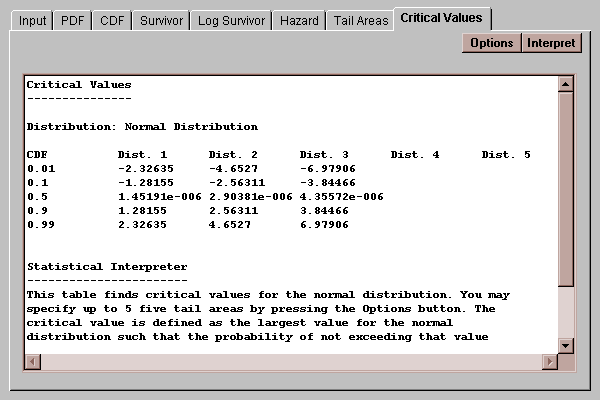
By default, critical values of X are calculated at tail areas of 1%, 10%, 50%, 90%, and 99%.
Use this dialog box to specify the tail areas at which critical values are desired: