This Statlet creates a variety of scatterplots for three columns of numeric data. The tabs are:
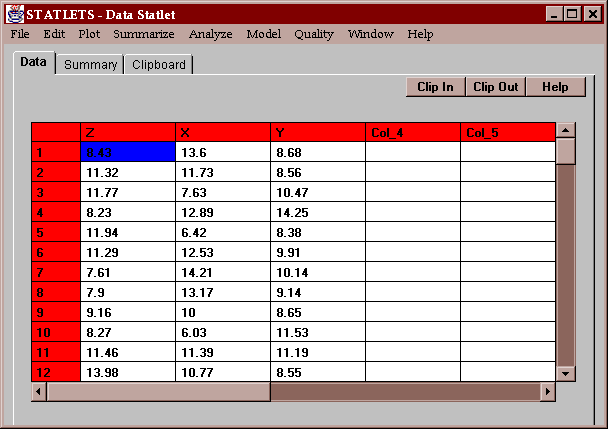
The example for this statlet consists of three columns of 100 random numbers each, generated from a normal distribution with a mean equal to 10 and a standard deviation equal to 2:

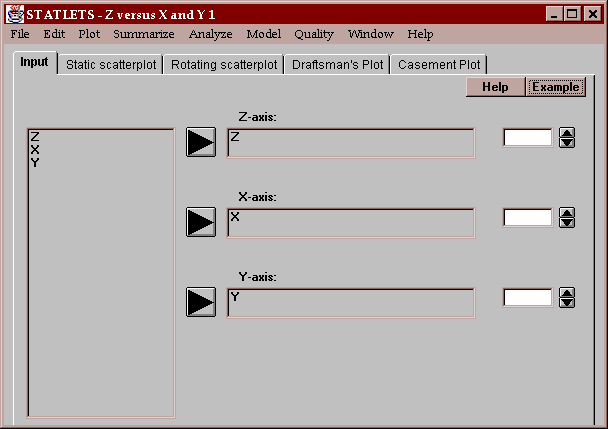
Enter the names of three columns of numeric data:
This tab generates a three-dimensional scatterplot:
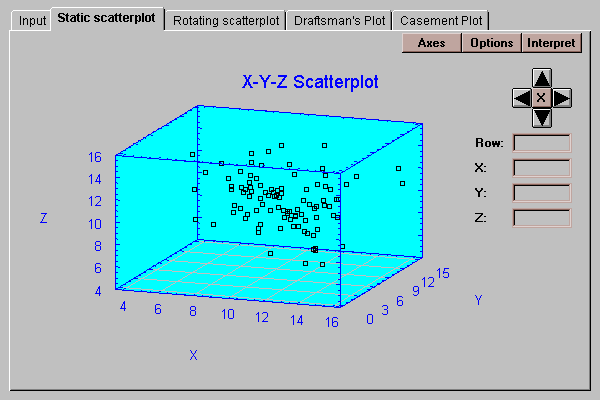
Each point on the plot represents a separate case or row. Notice the placement of the X, Y and Z axes. All 3-dimensional plots in STATLETS define their coordinate system as shown in the above plot.
The plot is viewed initially from a default viewpoint. You may change the viewpoint by pressing any of the four arrows on the panel, causing the plot to rotate. To return to the initial viewpoint, press the button labeled with an "X".
Clicking on any point displays its row number and (X,Y,Z) coordinates.
Pressing the Options button displays the following dialog box:
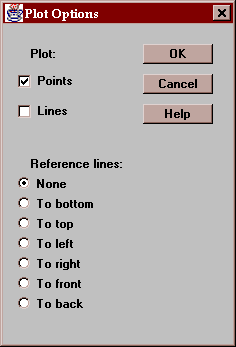
You may select to plot points, lines, or both. You may also select to draw reference lines from each point to a selected side of the cube ("To bottom" is the most common choice). Drawing lines to the base can add depth perception to the plot. A plot with reference lines drawn to the bottom is shown in the next section.
This tab generates the same output as the "Static Scatterplot" tab:
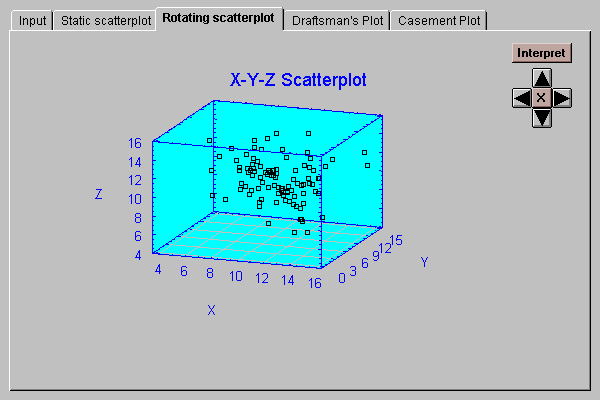
However, pressing any arrow button starts the plot rotating in real time in the indicated direction. Press a button to start the rotation. Press the button again to stop the rotation. Press the "X" arrow to stop all rotation and return the plot to its default viewpoint.
This tab plots a top, front and side view of the three-dimensional cube:
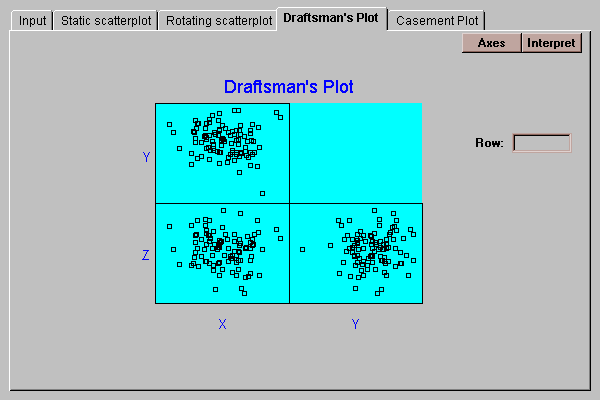
The three plots are:
top left: Y versus X (top view of cube).
bottom left: Z versus X (front view of cube).
bottom right: Z versus Y (side view of cube).
Click on any point and it will be highlighted in all three plots.
This tab produces a casement plot of the data:
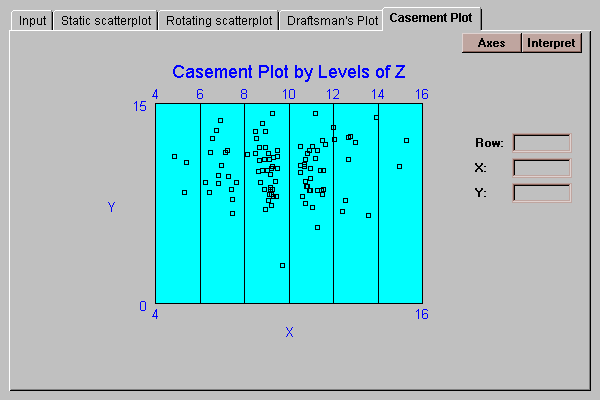
A casement plot is a sequence of plots, similar to panes in a casement window, showing Y versus X for different subsets of Z. For example, the six panes above show points which fall within the Z intervals 0-3, 3-6, 6-9, 9-12, 12-15, and 15-18 (the lower end of each interval is exclusive, while the upper end is inclusive). Each of the 100 points falls in exactly one interval.