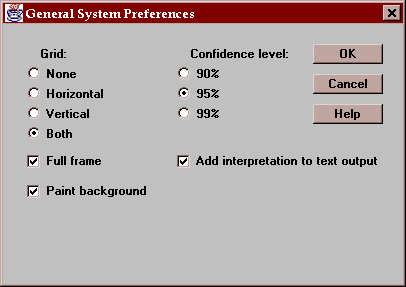
The "Preferences" selection on the edit menu allows you to specify how certain aspects of the system will behave. Is does so through the following dialog box:

The following selections may be made:
Grid - specifies the type of grid to be displayed on plots. Some plots may contain less grid lines than shown here, if lines in a certain direction would have no meaning. However, selecting a setting other than "Both" will suppress the lines in the horizontal and/or vertical direction on all plots.
Full frame - indicates whether the axis frame drawn on a plot will have 4 sides (if checked) or 2 sides.
Paint background - indicates whether the area within the axis frame will be filled in with a color different from the rest of the background. To change the color, press the Axes button on any plot.
Confidence level - specifies the default confidence level to be used by all statlets. This affects confidence intervals and the interpretation of P values by the statistical interpreter.
Add interpretation to text output - if checked, the statistical interpreter automatically adds its output to the bottom of all text panels. Whether checked or not, the interpretation can always be displayed by pressing the "Interpret" button on any panel.
Changes made in this dialog box affect all statlets in the current session. Since Java 1.0 and current browsers do not allow writing files to a local disk, these settings cannot be saved from one session to another. This will be changed as soon as new versions of Java are available.