Null & Alternative Hypothesis
![]()
![]()
![]()
Significance Level Of the Test
a
a
a
Test Statistics
p-value
![]()
Table IV
![]()
Table IV
![]()
Table IV
Decision
![]()
TEST OF HYPOTHESIS FOR THE DIFFERENCE BETWEEN POPULATION PROPORTIONS
|
Null & Alternative Hypothesis |
|
|
|
|
Significance Level Of the Test |
a |
a |
a |
|
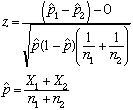
Test Statistics |
|
||
|
p-value |
Table IV |
Table IV |
Table IV |
|
Decision |
|
||
In the past decade intensive antismoking campaigns have been sponsored by both federal and private agencies. Suppose the American Cancer Society randomly sampled 1,500 adults in 1989 and then sampled 2,000 adults in 1999 to determine whether there was evidence that the percentage of smokers had decreased. The results of the two independent sample surveys are shown in the following table.
|
1989
|
1999
|
|
| Number of Observations |
1,500
|
2,000
|
| Number of Smokers |
551
|
652
|
a. Use the data in the table to test the hypothesis that the proportion of smokers changed from 1989 to 1999. Carry out your test at a significance level of 0.05.
The output will include: Sample sizes, Means, Proportions, Difference of proprtions, a 95% confidence interval for the difference between population proportions, and the results of the test.
Report the p-value of the test and present your conclusion.
b. Do this data indicate that the fraction of smokers decreased over this 10-year period? Use a significance level of 0.01.
Report the p-value of the test and present your conclusion.