Example:
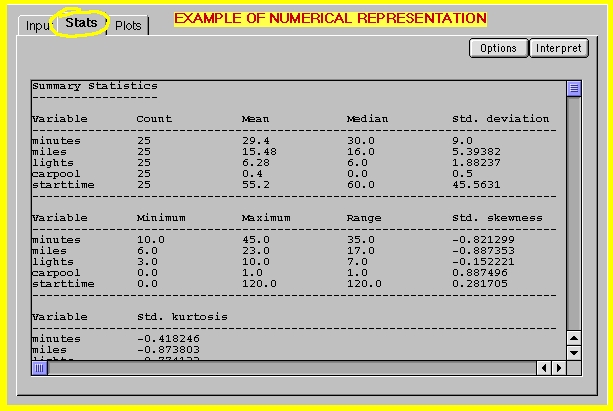
• Click on the Example button on the Statlets window at the end of this page. Note how the data has been entered. Ther are five variables in this data
• Click on Stats, you will see the following window
Statlets will allow you to calculate various numerical summaries of the data. To see these options
• Click on the Options button on the upper right corner of the Statlets window at the end of this page.
• Click on Stats, you will see the following window
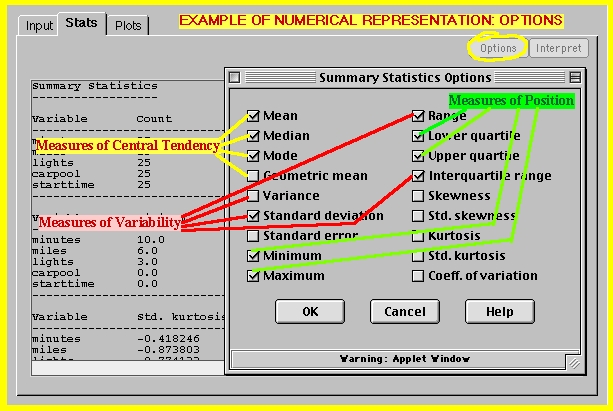
• Select the measure(s) of center, variability and position that you would like to calculate.
Learning Check:
The data that will pop up when you click on
 gives the exam scores of 40 students
in sociology, music, and physics courses.
gives the exam scores of 40 students
in sociology, music, and physics courses.
• Enter the data.
• Click on the Stats.
• Click on the Options.
• Select mean, median, standard deviation, interquartile range, range, lower quartile and upper quartile.
• Click on the OK.
• Interpret the output.