
Example:
• Click on the Example button on the Statlets window at the end of this page. Note how the data has been entered. First column is the list of categories (levels of the qualitative variable) and the second column is the frequencies (counts) for each category. At this point of your learning ignore the last column.
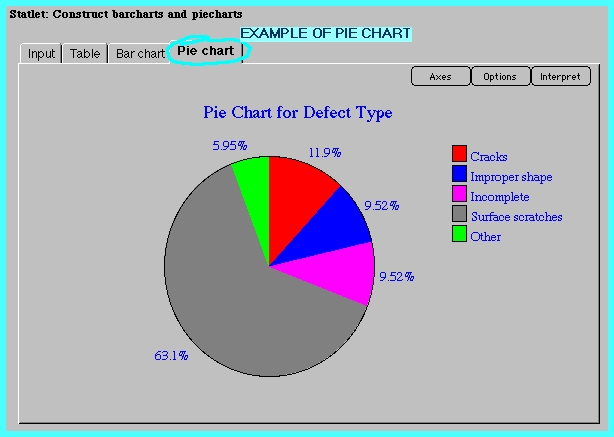
• Click on Pie chart, you will see the following window
Learning Check:
The data that will pop up when you click on
 the gives the academic
level of 26 undergraduate students at University of Minnesota Morris who
are registered for Statistical Methods Course.
the gives the academic
level of 26 undergraduate students at University of Minnesota Morris who
are registered for Statistical Methods Course.
• Enter the data by replacing Defect Type with Academic Level.
• Click on the Pie chart menu option.
• Interpret the output.