This statlet performs a frequency tabulation for a column of numeric or non-numeric data. It finds all of the unique values in the column and counts how many times each value occurs. The tabs are:
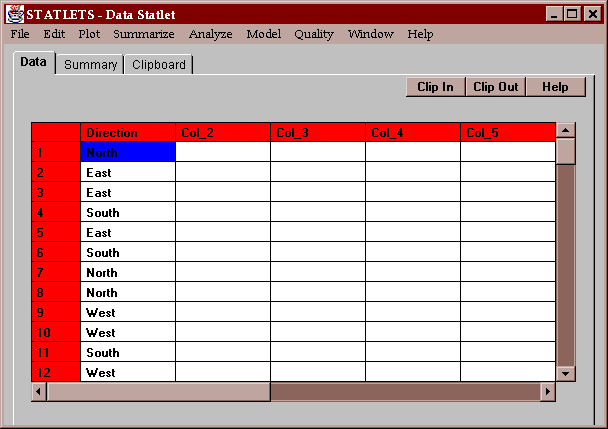
The sample data consist of 96 observations indicating the direction of travel of a randomly sampled group of commuters:

The column consists of four unique values: North, South, East and West.
Indicate the column containing the data to be tabulated:
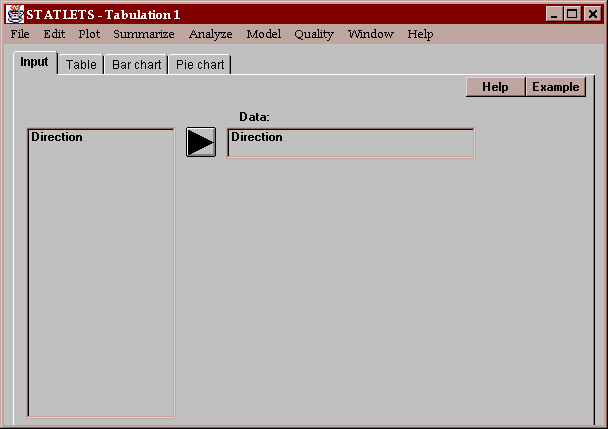
The column may contain both numeric and non-numeric values.
This tab shows each the number of times each unique value occurred and the percentage it represents of the total:
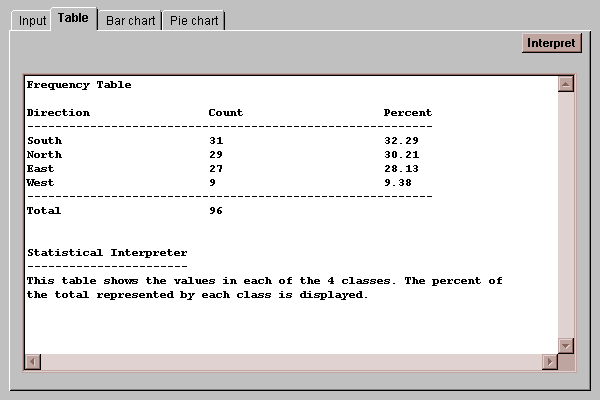
The most common direction of travel is South, specified by 31 of the 96 commuters. This represents slightly more than 32% of all respondents.
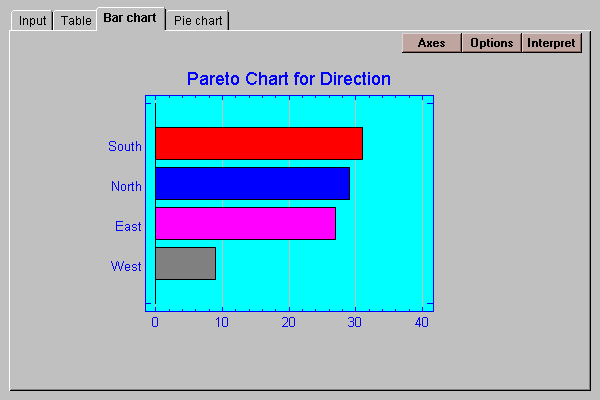
This tab draws bars with length proportional to the number of observations in each class:
The Options button allows you to change various aspects of the plot:
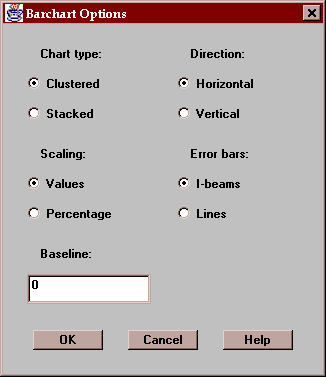
These include:
Chart type - the bars may be clustered side-by-side or stacked on top of one another.
Scaling - the scaling may show either the frequency of occurrence of each value or the percentage.
Direction - the bars may extend in the horizontal or vertical direction.
Baseline - this specifies the numeric value from which the bars are drawn. If greater than the smallest bar, bars may extend below the baseline.
This tab draws a pie chart with slices which are sized proportionally to the percentage of times each unique value occurs:
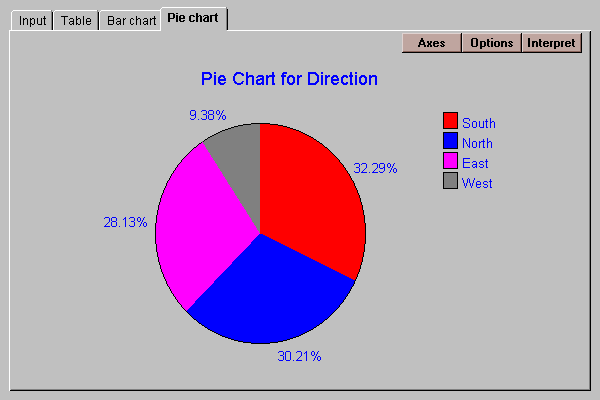
Notice that the bar corresponding to South has the largest area..
The Options button allows you to change various aspects of the plot:
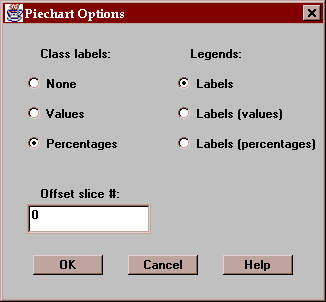
These include:
Class labels - labels drawn by each slice may show the values, percentages, or neither.
Legends - the legend block at the right of the plot may show the class labels, labels with values, or labels with percentages.
Offset slice # - if desired, specify a single slice to be offset from the rest of the pie. Slices are numbered in a clockwise direction starting at 12:00 o'clock.