All data to be analyzed in STATLETS is placed into columns of a spreadsheet. When operating in menu mode, the spreadsheet appears on the initial tab of the datasheet statlet. This section describes that statlet and its tabs:
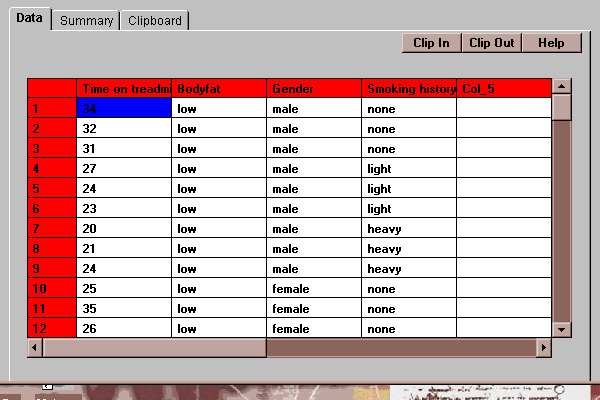
The STATLETS datasheet consists of a set of rows and columns as shown below:

Each column of the spreadsheet has a name and represents a variable. Each row represents a case. For example, the above spreadsheet contains the results of an experiment performed on a treadmill to determine the effect of bodyfat, gender and smoking history on the length of time various subjects took to reach a specified level of stress. Each row represents a separate subject.
When entering data into the spreadsheet, move the cursor to any cell and begin typing. Your entry will replace the current content of the cell. You may also click twice on a cell to edit the current contents.
Cells may contain two different types of data: numeric and non-numeric. Any entry which does not form a valid number is treated as a missing value by statlets expecting numeric entries.
To verify that a column contains the expected number of numeric entries, press the Summary tab.
To change the name of a column, click on the current name and change it.
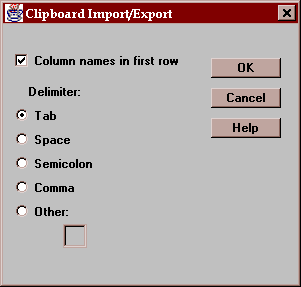
These buttons allow you to move data from the datasheet Clipboard, which is described below. When pressed, the following dialog box will be displayed:

When transferring data to and from the clipboard, you may specify:
Column names in first row - check this box if the first row of your file contains names for the columns. If not checked, default column names will be assigned to each column.
Delimiter - specify the delimiter character (tab, space, semicolon, comma, or a character which you specify).
On "Clip In", the contents of the spreadsheet is replaced by the contents of the clipboard. On "Clip Out", the contents of the clipboard is replaced by that of the spreadsheet.
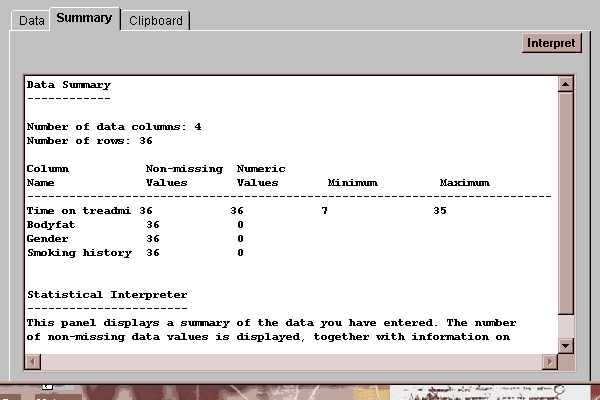
This tab shows a summary of the contents of the spreadsheet:

It indicates for each column:
Column Name - the name assigned to the column.
Non-missing Values - the number of non-blank cells in the column.
Numeric Values - the number of non-blank cells which represent valid numeric values.
Minimum - for a column with at least 1 numeric value, the smallest value.
Maximum - for a column with at least 1 numeric value, the largest value.
Notice that each column of the current spreadsheet contains 36 entries. Only the column named "Time on treadmill" has any valid numeric data.
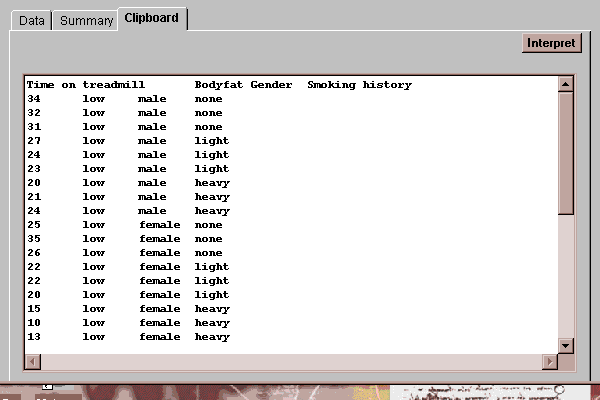
The clipboard area in the datasheet statlet is an edit field into which data may be typed or pasted:

It is most commonly used to transfer data to and from applications running on a local computer, while STATLETS is being running from the Internet. For example, to transfer a data file from a spreadsheet such as Excel or 1-2-3:
This round-about method of reading data is necessary because of current security restrictions built into the Java language. It is expected that direct file access will be available for applets in the near future.