STATLETS™ is a collection of 100% Pure Java applets for statistical analysis and graphics. This User Manual describes the basic operation of the package and each of the statlets contained within it.
This chapter describes:
There are two basic modes of operation for STATLETS:
Menu mode is normally the most convenient way to operate STATLETS. However, in standalone mode, individual statlets can be imbedded in user-created HTML files if desired.
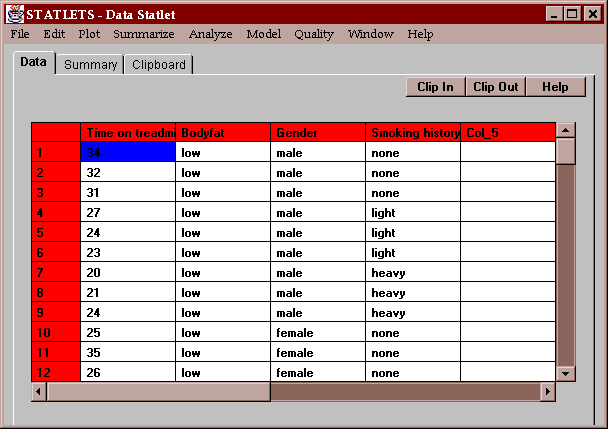
In menu mode, the data to be analyzed is typed directly into the cells of a spreadsheet which appears on the initial tab panel:
Each column represents a separate variable, while the rows represent cases. STATLETS recognizes two types of data:
You may mix numeric and non-numeric values in the same column. However, if you select a procedure which requires numeric data, anything which is not a valid number is treated as a missing value.
When you select a statlet, a tab panel is displayed listing all columns in your spreadsheet:
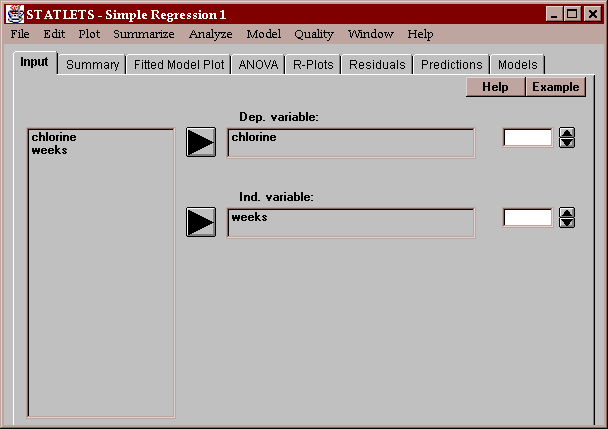
You select the columns to be analyzed by clicking on the desired name in the list and then clicking on an arrow to enter that name into the data specification fields. In many cases, you may select to transform the data values by clicking on the spinner which is placed to the right of the input field. Transformations available are:
In the above list, transformations above "(blank)" are frequently used to eliminate negative skewness in a sample. The transformations below "(blank)" are used to eliminate positive skewness.
In standalone mode, the initial panel displayed by each statlet contains a small spreadsheet with just enough columns for the required data:
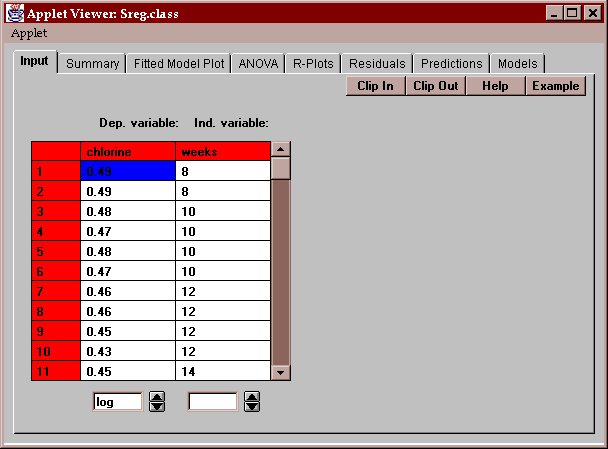
Along the top of each column is a label showing which variable should be placed in each column. The transformation spinners are placed below each column which may be transformed.
Data may also be copied into the spreadsheet using your operating system's clipboard. For a detailed discussion of this and other data options, see Chapter 1.
Each statlet has a built-in sample data set. The initial panel displayed by the statlet has a button labeled "Example". If you press the button, the sample data will be loaded into the proper columns. You may then press the other tabs to see the type of output which that statlet creates.
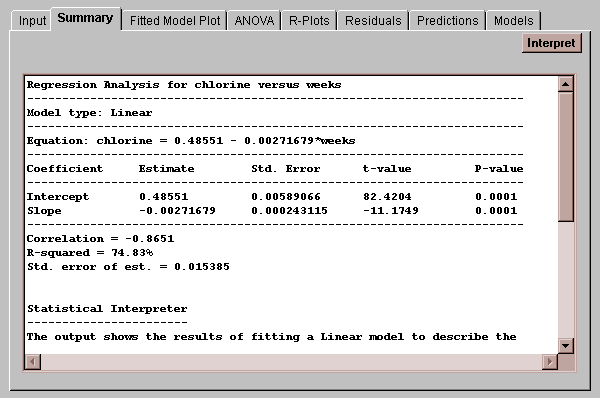
Once the columns have been selected, press any tab along the top of the statlet panel. Either a table of a graph will be created. Tabular output is placed in a single edit field with scroll bars if necessary:
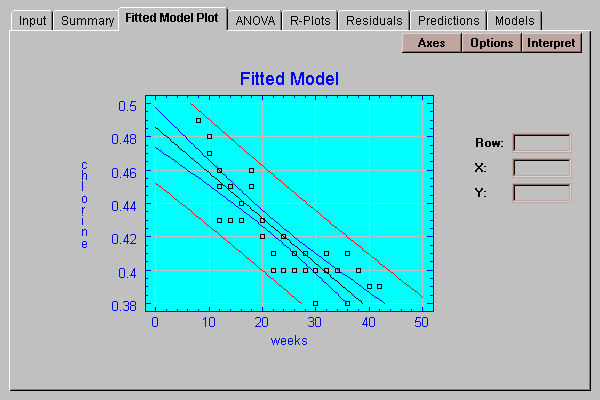
Graphics output is drawn directly on the tab panels:
You may move between tabs as often as desired. If you return to the input panel (or the spreadsheet) and change the data or variable selections, all other tabs will be automatically recalculated to reflect the changes.
Notice that the two panels displayed above have a button labeled "Options". Pressing that button will display a dialog box allowing you to select options for that panel. Graphics panels also have a button labeled "Axes". Pressing that button will display a dialog box allowing you to change axis titles, axis scaling, points sizes, and the colors used on the graph.
For more information on options, see the documentation for the individual statlets.
For information on rescaling graphs, see Chapter 3.
After each graph or text panel has been created, an interpretation of the output is placed in a dialog box which you may display by pressing the "Interpret" button. By default, the interpretation of text panels is also placed at the bottom of the panel's edit field. You may suppress the interpretation of edit panels by selecting Preferences under Edit on the top menu (see Chapter 2).
Limitation of Java 1.0 and current browsers prohibit Java applets from sending output to local printers. In order to obtain printed output, you must do the following:
Since text output is placed in edit fields, you may copy it to your operating system's clipboard by:
Direct printing will be available when new releases of Java permit it.
To print graphics panels, you must use a screen grabber to grab the output. The graphs in this user manual were grabbed by a program called "Snagit" which may be downloaded from TechSmith Corporation's web site at www.techsmith.com.