I. Chapter 1
Introduction to Probability Theory
I.1. Case Study
(Motivation: Application of the topics that will
be covered in this chapter to the real world problems)
Radelet
(1981) studied effects of racial characteristics on whether individuals
convicted of homicide receive the death penalty. The events that are considered
on this study are the selection of a case with "death penalty
verdict", "not death penalty verdict", "white
defendant", "black defendant", "white victim", and
"black victim". The 326 subjects were defendants in homicide
indictment in 20 Florida counties during 1976-1977. The following table gives
the number of subjects for each of the defendant's race, victim's race and
death penalty combinations.
|
Death Penalty
|
|
Defendant's Race
|
Victim's Race
|
Yes
|
No
|
Total
|
|
White
|
White
|
19
|
132
|
151
|
|
|
Black
|
0
|
9
|
9
|
|
Black
|
White
|
11
|
52
|
63
|
|
|
Black
|
6
|
97
|
103
|
|
Total
|
|
36
|
290
|
362
|
Source: Agresti, A. Categorical Data Analysis, John
Wiley & Sons, 1990, pg. 135-138
The
main question that one would like to answer is "Is there an evidence of
racial discrimination given the evidence on this table?". Also, one would
be interested with the following questions; (i) is there a relation between
defendant's race and victim's race?, (ii) is there a relation between victim's
race and death penalty? (iii) If we control for the victim's race, that is if
we look at the cases for black victims and white victims separately, what is
the relation between defendant's race and death penalty verdict?
I.2. Historical Remarks
(Motivation)
In the long run, we are all dead.
-John Maynard Keynes (England, 1883-1946)
People
talk loosely about chance all the time, without doing any harm. What are the
chances of getting a job? of meeting someone? of rain tomorrow? of passing
Math. 3610? But for scientific purposes, it is necessary to give the word
chance a definite, clear
interpretation. This turns out to be hard, and mathematicians have struggled
with the job for centuries. They have developed several careful and rigorous
theories of chance; but the theories cover just a small range of cases where
people ordinarily speak of chance.
Exercise
1. How would you explain the fact
that when you toss a coin the chance of getting head is one-half? How many
possibilities we have if you toss a coin? Can you repeat the experiment, that
is tossing a coin, under the same conditions many times?
Exercise
2. What is the meaning of
"chance of passing Math. 3610 is 0.80"? How many possibilities we
have for this experiment? Can you repeat the experiment, that is taking Math.
3610, under the same conditions many times? What could be the conditions that
would change if you repeat the experiment?
Frequentist
definition of chances works best for the processes that can be repeated over
and over again, independently under the same conditions. Games of chance fall
into this category, and in fact much of the frequency theory was developed to
solve gambling problems. One of the great masters was Abraham de Moivre, a
French Protestant who fled to England to avoid religious persecution. In his
book The Doctrine of Chances he
included the following letter,
To the Right Honorable the
Lord CARPENTER
My Lord
There are many people in the World who possessed with an
Opinion, that the Doctrine of Chances has a Tendency to promote Play; but they
soon will be undeceived... Your Lordship does easily perceive, that this Doctrine
is far from encouraging Play, that is rather a Guard against it, by setting in
a clear light, the Advantages and Disadvantages of those Games wherein Chance
is concerned...
Another use to be made of this Doctrine of Chances is
that it may serve in conjunction with the other parts of the Mathematicks, as a
fit introduction to the Art of Reasoning: it being known by experience that
nothing can contribute more to attaining that Art, than the consideration of a
long Train of Consequences, rightly deduced from undoubted Principles, of which
this Book affords many examples.
Historically,
probability had its origin in the gambling room. The Chevalier de Mere, a
professional French gambler, had asked his friend Blaise Pascal (1623-1662) to
solve the following problem: In what proportion should two players of equal
skill divide the stakes remaining on the gambling if they are forced to stop
before finishing the game? Pascal wrote to and began an active correspondence
with Pierre Fermat (1601-1665) concerning the problem (collaboration). Although
Pascal and Fermat agreed on the answer, they gave different proofs
(nonuniqeness of the solutions). It was in this series of correspondences
during the year 1652 that they developed the modern theory of probability.
A
century earlier the Italian mathematician and gambler (interesting
combination!) Girolomo Cardan (1501-1576) wrote The Book on Games of Chances. This is really a complete textbook for gamblers
since it contains many tips on how to cheat successfully. Cardan was also an
astrologer. According to the legend, he predicted his own death astrologically
and to guarantee its accuracy he committed a suicide on that day. (Of course,
that is the most convincing way to be right!) Like Cardan, De Moivre predicted
the day of his death. A rather interesting story is told of De Moivre's death.
De Moivre was ill and each day he noticed that he was sleeping 15 minutes
longer than he did on the preceding day. Using progressions, he computed that
he would die in his sleep on the day after he slept 23 hours and 45 minutes. On
the day following a sleep of 24 hours, De Moivre died.
The
French mathematician Pierre Simon de Laplace (1749-1827) also contributed much
to the historical development of probability. In 1812 he published Theorie
Analtique des probabilities, in
which he referred to probability
as a science that began with games but that had wide-ranging applications. In
particular, he applied probability theory not to gambling situations but as an
aid in astronomy.
Over
the course of many years probability theory has left the gambling rooms and has
grown to be an important and ever-expanding.
I.3. Review
Set
Theory
In
this section we will look at the basic notions and notations needed for dealing
with sets (collection of objects of various kinds, such as
numbers or paired of numbers, called points). Although you may have dealt with
these concepts since grade school, it is important that this chapter be
utilized to assure the sound base for the applications of the probability that
follow in Chapter 1 of your textbook.
"Set"
is an undefined notion (like "point" or "line" in
high-school geometry); it is assumed that at least one exists, and attention is
restricted to a universe or
universal set. In probability theory universal set corresponds to
the sample space S, sets
correspond to the events. All operations on sets are with respect to S in
order to avoid paradoxical situations.
Exercise
4. The Barber of Seville shaves all
men who don't shave themselves. Who shaves the Barber of Seville.
Basic Set Operations
There
are four basic set operations which we
will illustrate their meanings with diagrams called Venn diagrams.
Definition
1. Union (or join, or sum) of sets E and F:
E
È F
º
E + F º {w: w Î E or w Î F} (which you read the last notation as E union F
consists of points w which are elements of E or F).
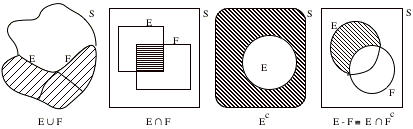
Definition
2. Intersection (or meet, or product) of sets E and F:
E Ç F º EF º {w: w Î E and w Î F}.
Definition
3. Complement of set E:
Eº º E' º {w: w Î S and w Ï E}.
Definition
4. Difference of sets E and F:
E - F º E Ç Fº {w: w Î E and F Ï F}.
Additional Definitions on Sets
Definition
5. E is a subset of F, written E C F, if w Î E Þ w Î F.
Definition
6. The empty set (or null
set), usually written Æ, is the set containing no
points at all.
Definition
7. Sets E and F are said to be mutually
exclusive (or disjoint) if
E
Ç F
= Æ.
Simple Laws and Some Extensions on Sets
In
the following theorem we are going to state some simple laws dealing with the
operations on sets.
Theorem
on Sets: Let S be the sample space and E, F, and G be the
events on S. Then
1. E Ç E = E, and E È
E = E (Idempotency Laws).
2. E Ç F = F Ç E, and E È F = F È E (Commutative Laws).
3. E Ç (F Ç G) = (E Ç F) Ç G, and E
È (F È G) = (E È F) È G (Associative Laws).
4. E Ç (F È G) = (E Ç F) È (E Ç G) , and E È (F Ç G) = (E È F) Ç (E È G) (Distributive
Laws).
5. E
Ç S
= E, E
È S
= S,
E
Ç
Æ = Æ, E È Æ = E,
E
Ç E= Æ, E È E= S,
6. (E Ç F)= EÈ F, and (E È F)= EÇ F.
7.
(E)= E
8. F is a subset of E if and only if E Ç F = F.
9. F is a subset of E if and only if E È F = E.
Although
the terminology given in parentheses is not now in widespread use, it is
important to expose to it in order to be able to read other (and older) books
and writings.
Exercise
5. Translate the following informal
statements and definitions into the formal form by using the set notations.
|
Occurrence of two thing at
the same time
|
|
|
Occurrence of one thing
prevents the occurrence of the other
|
|
|
Occurrence of one thing
implies the occurrence of the other
|
|
|
Occurrence
of either one of the two thing
|
|
|
Occurrence of an opposite
of one thing
|
|
|
Occurrence of three things
at the same time
|
|
|
Occurrence of only one of
the two things
|
|
|
Occurrence of one thing
given the occurrence of the other
|
|
|
Occurrence of any one of
the possibilities
|
|
|
Occurrence of an neither
one of the two things
|
|
|
Occurrence of the either
one of the three distinct things
|
|
I.4. Overview
Where
We're Going
Today,
probability theory is a well established branch of mathematics that finds its
applications in every area of scholarly activity from music to physics, and in
daily experience from weather prediction to predicting the risk of a new
medical treatment.
Most
important of all it will give us the necessary tools to find a measure of
reliability for the generalizations that we are going to make from sample to
the whole population. For example when you say "Vikings will win the super
bowl in 1992-93", is this statement reliable 100%? What is the reliability
measure of this statement?
To
understand the importance of the probability theory better, we should grasp the
difference between theory and reality. But note that reality does not always turn out to
be same as theory, that is what we expect. For example, in the theory if you
get your graduate degree, you should be able to get a well-paid job. But a
person with a graduate education may end up with a low-paid job.

Theories
are ideas proposed to explain phenomena in the real world and, as such, are
approximations or models for reality. These models are expressed either in a
verbal form or as mathematical relationships. Whereas the theory of social
change might be expressed verbally in sociology, the theory of heat transfer is
presented in a precise and deterministic mathematical manner in physics.
Neither gives an accurate and unerring explanation of the real life. Slight
variations from the mathematically expected can be observed in heat transfer
phenomena and other areas of physics. The deviations can not be blamed solely
on the measuring instruments, the explanation that one often hears, but are due
in part to a lack of agreement
between theory and reality. Anyone who believes that the physical
scientist completely understands the wonders of this world need only look at history to find a
contradiction. Theories assumed to be the "final" explanation for
nature have been superseded in rapid succession during the past century.
In
this course, we shall develop certain models of reality (probabilistic models);
we shall attempt to explain the motivation behind such a development and uses
of the resulting model. We will never claim that some statement is always
correct, but we will attach reliability, a type of chance statement on the
validity of our statement.
Reading
Probabilistic Statements
Exercise
6. Translate the following informal
statements and definitions into the formal form by using the notations used in
your text. The informal statements are taken from the Doctrine of Chances.
|
The chance of something
gives the percentage of time it is expected to happen, when the basic process
is done over and over again, independently under the same conditions.
|
P(E)=
|
|
The chances are between 0%
and 100%
|
|
|
The chance of something
equals 100% minus the chance of the opposite thing.
|
|
|
If the occurrence of one
thing prevents the occurrence of the other, then the chance of observing these
two things together is zero.
|
|
|
If the chance of
occurrence of one thing is not affected by the occurrence of the other thing
they are called independent.
|
|
|
Given the occurrence of
one thing the chance of occurrence of another thing is proportional to chance
of observing these two together, and inversely proportional to the chance of
observing the given thing
|
|
|
The chance of observing
two things at the same time is equal to the chance of observing one of them
times the chance of observing other given the one we know its occurrence
chance.
|
|
|
Two things are independent
if the chances for the second one given the first are the same, no matter how
the first one turns out.
|
|
|
The chance of occurrence
of one thing is equal to the chance of occurrence of a second thing and that
thing together, plus the chance of nonoccurrence of the second thing and that
thing together.
|
|
|
If two things can not
occur together than the chance of observing either one of them is the sum of
chance of observing each.
|
|
I.5. Technical Details
The following are the basic
results that you have learned in this chapter:
P(E) = 1 - P(E)
P(E È F) = P(E) +
P(F) - P(E Ç F) = P(E) + P(F) - P(EF)
P(E | F) =
If E and F are mutually
exclusive then,
P(EF) = 0
If E and F are independent then, P(EF) = P(E)P(F)
If E and F are independent
then, P(E | F) = P(E) and P(F | E) = P(F)
P(E) = P(EF) + P(EF)
Exercise 7. Fill out the following table with the formulas that
you would use to find the required probability given the information in the
first column.
|
GIVEN
|
FIND
|
GENERAL
|
MUTUALLY
EXCLUSIVE
|
INDEPENDENT
|
|
P(E),
P(F),
P(E È F)
|
P(EF)
|
P(EF) =
P(E) + P(F) - P(E È F)
|
P(EF) = 0
|
P(EF) =
P(E)P(F)
|
|
P(E | F),
P(F)
|
P(EF)
|
|
|
|
|
P(F | E),
P(E)
|
P(EF)
|
|
|
|
|
P(E | F),
P(F),
P(E)
|
P(EF)
|
|
|
|
|
P(E | F),
P(E | F), P(F)
|
P(E)
|
|
|
|
|
P(E | F),
P(E | F), P(F)
|
P(F | E)
|
|
|
|
|
P(E),
P(F), P(G), P(EF), P(EG), P(FG), P(EFG)
|
P(E È F È G)
|
|
|
|
|
P(EFG),
P(FG)
|
P(E | FG)
|
|
|
|
|
P(EFG),
P(E)
|
P(FG | E)
|
|
|
|
Independent, Mutually Independent and Pairwise Independent Events
Definition: The events E, E, ..., Eare said to be mutually independent if
P(EE... E) = P(E)P(E) ... P(E).
Definition:
The events E, E, ..., Eare said to be pairwise independent if
P(EE) = P(E)P(E) for all i ¹
j.
Definition:
The events E, E, ..., Eare said to be independent if for every subset
E, E, ..., E, r ≤ n, of these events
P(EE... E) = P(E)P(E) ... P(E).
Exercise
1: Consider the set of events E, E, E, E. What properties need to be shown to establish that
these events are independent?
For
random events we consider the notions of mutually independence and pairwise
independence. The questions of interest are: (i) Are there sets of random
events which are pairwise independent but not mutually independent?, (ii)
Conversely, are there sets of random events which are mutually independent but
not pairwise independent? In the following two examples we will try to answer
these questions.
Example
(pairwise independence does not imply mutual independence): (Berstein, 1928) Suppose that a box contains 4
tickets labeled by 112, 121, 211, and 222. Experiment consists of drawing one
ticket at random from the box. Let
E= "1 occurs at the first place"
E= "1 occurs at the second place"
E= "1 occurs at the third place".
It
follows that
P(E) = P(E) = P(E) = = ,
P(EE) = P({112}) = = P(E)P(E),
P(EE) = P({121}) = = P(E)P(E), and
P(EE) = P({211}) = = P(E)P(E).
That
is the events E, E, Eare pairwise independent. However the event EEE= Æ. Therefore
P(EEE) = 0 ¹ P(E)P(E)P(E) = = .
Exercise
2: A box contains eight tickets,
each labeled with a binary number. Two are labeled 111, two are labeled 100,
two 010, and two 001. An experiment consists of drawing one ticket at random
from the box. Let Ebe the event "the first digit is 1", Ebe the event "the second digit is one", and
Ethe event "the third digit is 1". Show that
E, E, and Eare pairwise independent but not mutually independent.
Example
(mutual independence does not imply pairwise independence):
An
experiment consists of tossing two different standard dice, white and black.
The sample space S of the outcomes consists of all ordered pairs (ij), i,j = 1,
2, ..., 6, that is
S = {11, 12, 13, ..., 66}.
Each
point in S has a probability 1/36. Define the following events:
E= "first die is 1, 2 or 3"
E= "first die is 3, 4 or 5"
E= "sum of the faces is 9".
Therefore,
EE= {31, 32, 33, 34, 35, 36},
EE= {36},
EE= {36, 45, 54},
EEE= {36}.
It
follows that
P(E) = P(E) = , P(E) = and
P(EEE) = = = P(E)P(E)P(E).
However
the events are not pairwise
independent, because
P(EE) = ¹ = P(E)P(E),
P(EE) = ¹ = P(E)P(E),
P(EE) = ¹ = P(E)P(E).
Exercise
3: In exercise 2, let us change the
number on one ticket from 111 to 110, and the number of another ticket from 100
to 101. Show that E, E, and Eare, this time, mutually independent but not pairwise independent.
How
to Solve Problems Related with the Probability?
Most
important element in the solution of the probability and statistics problems is
the nonuniqueness of the solution method. The following graphical and tabular
techniques are aimed to help to understand the problem better:
I. Straight forward logical
set up,
II. Tables representations,
III. Venn diagrams,
IV. Trees.
Straight
forward logical set up gives the fastest solution of the problem. But it
requires a deep understanding of the definitions, concepts, theorems, and
formulas. Last three techniques help to eliminate this difficulty. These
techniques help to develop a logical and systematic thinking process on the
solution of the problem. Direct, blind-folded use of formulas might endanger
logical thinking and generally leads to an incorrect solution of a problem.
Whatever technique one prefers, the basic steps are;
(i) Define the experiment,
(ii) Define the sample space
(simple outcomes of the experiment)
(iii) Define the events that
are given in the problem by using capital letters
(iv) For compound events use
the set notation that we discussed before
(v) Write down the event
that we would like to find the chance of occurrence on
(vi) Select the formula that
will give us that probability given the information on the events you defined
in (iii) & (iv).
(vii) Use your intuition and
prior knowledge on the result and interpret that number. Does it make any
sense? Is it what you expected?, If not, did you carry out your calculations
correctly?
Exercise
8: A softball team has three
pitchers, A, B, and C, with winning percentages of 0.4, 0.6, and 0.8,
respectively. These pitchers pitch with frequency 2,3, and 5 out of every 10
games, respectively.
(a)
What is the probability that the team will win the game?
(b)
Suppose that the team won the game what is the probability that A pitched the
game?
Understanding the problem:
What is the experiment? :
Each game in this problem is the experiment
What are the possible
outcomes of the experiment? : First of all A may pitch the game or B may pitch
the game or C may pitch the game. So let us label each one of these simple events
A
= the event that A will pitch the game
B
= the event that B will pitch the game
C
= the event that C will pitch the game
Secondly, the team may win
the game or lose the game, so let us label these outcomes
W
= the event that the team will win the game
L
= the event that the team will lose the game
What is the relation between
the events? That is are they mutually exclusive or independent?
Since
the team cannot win and lose the game at the same time W and L are mutually
exclusive.
If
we assume that only one pitcher pitches the whole game A, B, and C are also
mutually exclusive.
The
questions that you must have at this point are the following:
Are
the events A, W mutually exclusive? If yes, what does it say for the pitcher A?
Are
the events B, L mutually exclusive? If yes, what does it say for the pitcher B?
Are
the events A, W independent? If yes, what does it say for the pitcher A?
Are
the events B, L dependent? If yes, what does it say for the pitcher B?
The
translation of the mathematics notation to the daily language plays an
important role in understanding and solving problems related with probability.
The following table shows the translation of these languages from one another.
|
Mathematics
|
Notation
|
AW=Æ
|
|
|
Interpretation
|
The intersection of the
two sets A and W is empty
|
|
Statistics
|
|
The sets A and W are
mutually exclusive
|
|
English
|
Symbolic
|
"Winning the
game" and "A pitching the game" can not occur at the same time
|
|
|
Interpretation
|
If A pitches then we know
that the team will not win the game. Therefore, A is a terrible pitcher.
|
Now, fill out the following
table for the A and W being independent.
|
Mathematics
|
Notation
|
|
|
|
Interpretation
|
|
|
Statistics
|
|
|
|
English
|
Symbolic
|
|
|
|
Interpretation
|
|
What are the numbers that
are given in the statement of the problem?
First
of all the problem says A has a winning average 0.4. So A will win 40% of the
games. But for A to win the game it should play the game as a pitcher. In other
words A will win the game given that he plays the game. Therefore,
P(W
| A) = 0.40
P(W
| B) = 0.60
P(W
| C) = 0.80.
Since
these pitchers pitch with frequency 2, 3, and 5 out of every 10 games,
respectively;
P(A)
= 0.20
P(B)
= 0.30
P(C)
= 0.50.
The
first part of the problem is asking for P(W). What is the difference between
P(W) and any one of the following probabilities P(W | A), P(W | B), and P(W |
C)?
The
second part of the problem is asking for P(A | W). What is the difference
between P(W | A) = 0.40 and P(A | W)?
What
do you think that P(A | W) + P(B | W) + P(C | W) will be equal to?
Given
the information on P(A), P(B), P(C), P(W | A), P(W | B), and P(W | C), Do you
expect that P(A | W) will be greater than P(C | W) ? Why or why not?
Note
that the components that will affect the P(A | W) are (i) A should play, that
is P(A) and (ii) the team should win, that is P(W | A).
Now,
we will solve the problem by using the 4 techniques that we introduced above.
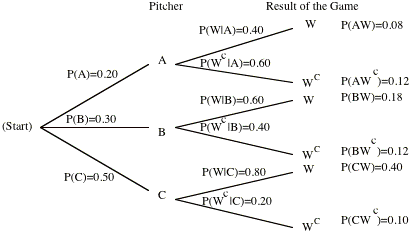
Solution
I. To find out P(W), one might use the following logical steps:
(i) In which cases the team
will win the game. The team will win the game when A pitches, or B pitches, or
C pitches. Therefore
"The team wins the
game" = "A pitches and the team wins"
or
"B pitches and the team wins"
or
"C pitches and the team wins".
By using our notation;
W = (A Ç W) È (B Ç W) È (C Ç W) =
AW È BW È CW
Are the events AW, BW, CW
mutually exclusive? Justify your answer.
P(W) = P(AW È BW È CW) = P(AW) + P(BW) +
P(CW) (Why?)
Do we know the value of
P(AW), P(BW), and P(CW)?
Can we find P(AW), P(BW),
and P(CW) given the information on P(A), P(B), P(C),
P(W | A), P(W | B), and P(W
| C)?
By using the multiplication
rule (definition of the conditional probability), we end up with
P(AW) = P(W | A) P(A) = 0.40 ´ 0.20 =
0.08
P(BW) = P(W | B) P(B) = 0.60 ´ 0.30 =
0.18
P(CW) = P(W | C) P(C) = 0.80 ´ 0.50 =
0.40
Note that the multiplication
rule on P(AW) can be used also as follows:
P(AW) = P(A | W)P(W). Why we
did not use this form?
Is P(AW) = P(A | W)P(W) = P(W
| A) P(A) ? Justify your answer.
Therefore, P(W) = P(AW) + P(BW) + P(CW)
= P(W | A)P(A) + P(W | B)
P(B) + P(W | C) P(C)
=
0.08 + 0.18 + 0.40 = 0.66
|
P(W)
= P(W | A)P(A) + P(W | B)
P(B) + P(W | C) P(C)
|
The second part of the
problem is asking for P(A | W).
By using the definition of the conditional probability, we end up with
How did we get the second
part of the above formula?
Therefore,
P(A | W) = = 0.121. Similarly P(B | W) = 0.273, and P(C | W) =
0.606.
We are going to interpret
these results after we discuss all of the solution techniques.
Solution
II. Tables. The information that is given in the problem can be
represented by using a table. In this table the rows will show the result of
the game, and the columns will show who pitches the game. The elements in the
table will provide the probability that the corresponding row and column
elements occur together.
|
|
A PITCHES
THE GAME
(A)
|
B PITCHES
THE GAME
(B)
|
C PITCHES
THE GAME
(C)
|
|
|
THE TEAM
WINS THE GAME
(W)
|
P(AW)
|
P(BW)
|
P(CW)
|
P(W)
|
|
THE TEAM
LOSES THE GAME
(W)
|
P(AW)
|
P(BW)
|
P(CW)
|
P(W)
|
|
|
P(A)
|
P(B)
|
P(C)
|
1
|
Note that this table gives
us some important formulas such as
P(AW) + P(BW) + P(CW) = P(W)
P(AW) + P(AW) + P(AW) = P(W)
If the conditional
probabilities are available table can be modified by using the multiplication
rule as follows;
|
|
A PITCHES
THE GAME
(A)
|
B PITCHES
THE GAME
(B)
|
C PITCHES
THE GAME
(C)
|
|
|
THE TEAM
WINS THE GAME
(W)
|
P(AW)=P(W|A)P(A)
|
P(BW)=P(W|B)P(B)
|
P(CW)=P(W|C)P(C)
|
P(W)
|
|
THE TEAM
LOSES THE GAME
(W)
|
P(AW)=
P(W|A)P(A)
|
P(BW)=
P(W|B)P(B)
|
P(CW)=
P(W|C)P(C)
|
P(W)
|
|
|
P(A)
|
P(B)
|
P(C)
|
1
|
Now, let us fill out the
table with the probabilities that are given
|
|
A PITCHES
THE GAME
(A)
|
B PITCHES
THE GAME
(B)
|
C PITCHES
THE GAME
(C)
|
|
|
THE TEAM
WINS THE GAME
(W)
|
0.4 ´ 0.2 = 0.08
|
0.6 ´ 0.3 = 0.18
|
0.8 ´ 0.5 = 0.40
|
P(W)=?=
|
|
THE TEAM
LOSES THE GAME
(W)
|
P(W|A)P(A)
|
P(W|B)P(B)
|
P(W|C)P(C)
|
P(W)=?=
|
|
|
0.20
|
0.30
|
0.50
|
1
|
Fill out the rest of the
table, and find P(W) and P(A | W).
Solution III. This time we will use a Venn diagram. Each region on the diagram will correspond to a
relevant event.

Since
the probability is a special type of measure, just like the area of each piece
on the graph, same type of argument that is given in the solution I can be used
to answer to the question.
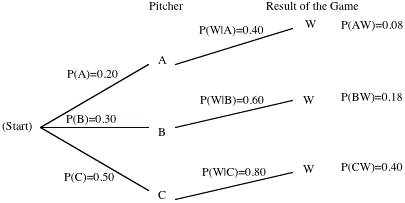
Solution
IV. Trees. When we analyze an experiment that takes place in a
sequence of steps, we often find it convenient to represent the sample space by
the set of all paths through the tree. A probability measure is assigned by
considering the conditional probabilities appropriate for the outcome of the
any step, given all previous outcomes. These weights are assigned at the
appropriate branches of the tree, and then the weights for a path through the
tree is the product of the branch weights along the path. In our experiment
first of all one of the pitchers should pitch the game then the team either
will win or lose. Therefore corresponding tree can be constructed as follows:
Mark the paths on the tree
where the team ends up winning the game. By using these paths write down the
formula for finding P(W)
Find the probability that
the team will win the game by using the above formula
Suppose that the team wins
the game. Given this information some of the branches of the tree will be
chopped off.
Write down the formula to
find P(A | W)
Use the formula to find P(A
| W)
Our
original tree gave us the probabilities for the result of the game given the
pitcher. The i.inverse probabilities,; that is probabilities for the
pitcher given the result of the game are called Bayes probabilities. These
inverse probabilities can also be obtained by simply constructing the three for
the two-stage experiment carried out in reverse order.
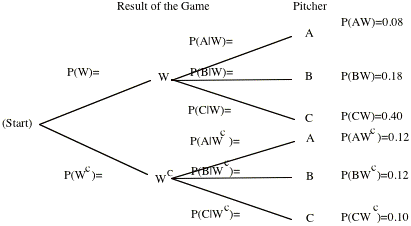
Fill out the rest of the
above reverse tree by using P(W) and P(W) that you have already found.
Interpretation of the
Results
In
this part we will try to interpret the results that we got. Note that if the
pitcher C pitched all the games the probability of winning would be 0.80. The
probability of winning reduces to 0.66 since all the games are not pitched by C
and all the pitcher are not equally good.
If
all the pitchers are equally good, say with the winning percentage 0.80, what
would be the probability that the team will win?
The winning percentages for
the pitchers A, B, and C are 0.40, 0.60, and 0.80 respectively. And A, B, C
pitches 20%, 30%, and 50% of the games.
Given the winning
percentages for each pitcher, is it reasonable if A, B, and C pitches 50%, 30%,
and 20% of the games?
If the team is winning the
probability that A is pitching the game is 0.121. If all the pitchers were
equally good, that is winning is independent to the whether A is pitching or
not, what would this probability be equal to?
What type of relation do you
expect between P(C | W) and P(C)? (P(C | W) > P(C) or
P(C | W) < P(C) or P(C |
W) = P(C))
Case
Study Revisited
Now
we are ready to answer the questions that we rose in our case study. The table
of frequencies can be changed into empirical probabilities as follows. For
example let us try to find the probability of selecting a case which involves
white defendant, white victim, and a death penalty verdict. There are 19 cases
out of 326 in which all of these events occurred together. Therefore the chance
of observing this event is 19/326=0.058.
Define the events of
interest for the case study.
A = "receiving a death
penalty verdict"
B = A=
C = "white
defendant"
D = C=
E = "white victim"
F = E=
What is the meaning of A and
C being mutually exclusive?
What is the meaning of A and
C being independent?
What is the meaning of C and
Ebeing mutually exclusive?
What is the meaning of C and
E being independent?
If there is no
discrimination, what type of relation you expect to see between A and C? That
is, do they have to be mutually exclusive, or independent, or both?
Which one of the following
probabilities will give you a better information on discrimination? P(A | C) or
P(C | A). Similarly P(A | D) or P(D | A).
Construct the marginal table
for defendant's race and the death penalty verdict by ignoring victim's race.
|
Death Penalty
|
|
Defendant's
Race
|
Yes
|
No
|
Total
|
|
|
White
|
|
|
|
|
|
Black
|
|
|
|
|
|
Total
|
|
|
|
|
Find
P(A)
P(A | C) =
P(A | D) =
P(C | A) =
P(D | A) =
Is there an evidence of
racial discrimination?
Construct the same table by
controlling for the victim's race. That is create a table for defendant's race
and death penalty verdict for white victims and black victims.
For white victims
|
Death Penalty
|
|
Defendant's
Race
|
Yes
|
No
|
Total
|
|
|
White
|
|
|
|
|
|
Black
|
|
|
|
|
|
Total
|
|
|
|
|
For black victims
|
Death Penalty
|
|
Defendant's
Race
|
Yes
|
No
|
Total
|
|
|
White
|
|
|
|
|
|
Black
|
|
|
|
|
|
Total
|
|
|
|
|
Find
P(A | CE) = P("death
penalty" | "white victim" and "white defendant') =
P(A | DE) =
P(A | CF) =
P(A | DF) =
Is there an evidence of
racial discrimination when we control for the race of the victim?
Construct a marginal table
for the defendant's race and victim's race.
|
Death
Penalty
|
|
Defendant's
Race
|
Yes
|
No
|
Total
|
|
|
White
|
|
|
|
|
|
Black
|
|
|
|
|
|
Total
|
|
|
|
|
Find
P(E | C) =
P(E | D) =
P(F | C) =
P(F | D) =
What type of relation we
have between defendant's race and victim's race?
I.6. Drunkard's Walk:
Random Walk:
Where is a drunk person going to end up?
Motivation: Scenario
Most
of the problems we encounter in daily living may be modeled probabilistically.
The probability models can help us to understand the nature of the problems
that we are facing better. Elementary probability models assume that the
possible outcomes for each experiment are the same and the outcome of one
experiment does not influence the outcomes of the other experiments
probabilistically. In some cases these assumptions are not valid. For example;
*
how much money you are going to have on your saving account next year depends
on how much money you have on this account this year,
*
next year’s interest and unemployment rates will be affected by the this year’s
rates,
*
a gambler’s fortune at a game depends on the gambler’s fortune at the previous
game (Gambler’s Ruin Problem)
*
the population size of an endangered species in year 2000 depends on the
population of this species in previous years.
Big Question
Which
leads to the big question: How do we model a phenomenon where knowledge of the
outcome of previous experiments influences our predictions for the outcomes of
the next experiment?
Learning Objectives
Learn
how to model chance processes for which the knowledge of previous outcomes
influences prediction for future experiment. After completing this activity you
should be able to construct a probability model for the cases where outcome in
the future given the outcomes in the past and present depends only on the
outcome that we observe in the present. You should also be able to see how
different tools, such as tree diagrams, graphs, matrices, and tables, can be
used to simplify the problem.
Background: Review, Definitions, Facts & Concepts
We
will be learning Markov chains that are a type of a stochastic process. A
stochastic process is a squenceof
random variables. One can represent a stochastic process as {X(t), tÎT} where for each tÎT, X(t) is a random variable. The index t is often
interpreted as time and, as a result, we refer to X(t) as the state of the
process at time t. T is called
the index set of the process. If
the index set is countable, the stochastic process is a discrete-time
process. If T is an interval of the real line, the stochastic
process is said to be a continuous-time process. Generally, the discrete-time process is represented
by Xn instead of X(t). S,
state space, is the set of all
possible random variables, X(t), of the stochastic process. A realization of a stochastic process is called a sample
path of the process.
As
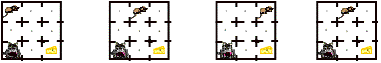
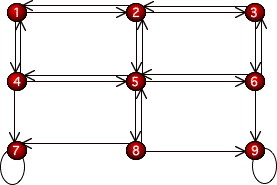
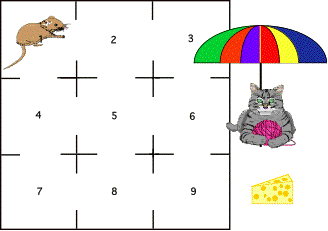
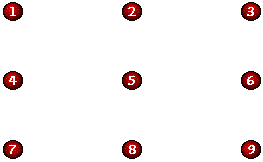
warm-up Activity, consider the Mouse
in a Maze. A hungry mouse starts in
cell 1, while a cat is hiding patiently in cell 7, and the cheese is in cell 9.
The mouse moves from cell to cell. . In the absence of learning, it will choose
the next cell to visit randomly from the adjoining cells. Assume that once the
mouse finds the piece of cheese or the cat, it will understandably stay there
forever.
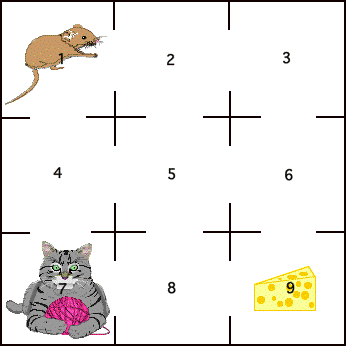
Here is a sample path for this example:
|
Step (n)
|
0
|
1
|
2
|
3
|
|
Xn
|
1
|
2
|
3
|
2
|
|
Step (n)
|
4
|
5
|
6
|
7
|
|
Xn
|
5
|
4
|
5
|
8
|

What do you understand when
one says
• X0=1
• X5=4
• X8=7
What is the state space S of this process?
First of all, why is this a stochastic
process?
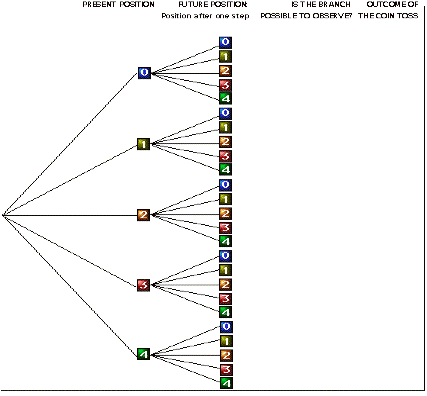
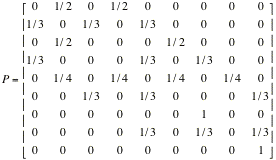
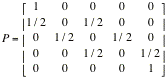
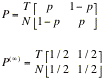
Study the following matrix;
it is called a one-step transition probability matrix.
What ideas do you have about how this matrix was constructed and what it
means?
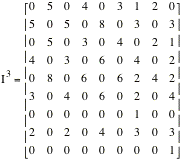
Study the following matrix;
it is called an incidence matrix. What ideas do you have about how this
matrix was constructed and what it means?

Study the following graph;
it is called a state diagram. What ideas do you have about how this
graph was constructed and what it means?
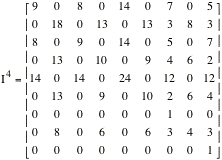
The
following matrix is obtained by multiplying the matrix I by itself. If you do not understand how to multiply
two matrices do not worry. Just tell us what you think that this matrix is
representing.

The
following matrix is obtained by multiplying the matrix I by itself three times. What do you think that this
matrix representing?
The
following matrix is obtained by multiplying the matrix I by itself four times. What do you think that this
matrix representing?
Suppose
that the cat is on vacation and you are given the following incidence matrix.

Draw the maze (some of the
doors between the cells are now closed)
Tell us where the cheese is.
Complete the following state
diagram.
Do
you think that drawing the above graph would help you to answer the last two
questions?
Now,
let us challenge ourselves. (I do not have slightest idea at this point whether
this can be solved or not) This time it is the Cheese’s turn to take a
vacation. You are given the following two-step incidence matrix.

Draw
the maze.
Find
where the cat is.

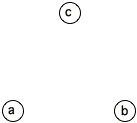
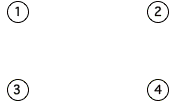
Learning Activity
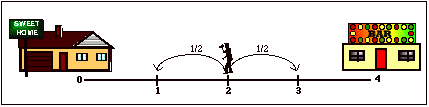
Suppose
that a person is walking along a four-block stretch of Park Avenue. The person
starts at corner x and with probability 1/2, walks one block to the right and,
with probability 1/2, walks one block to the left, when the person comes to the
next corner she/he again randomly chooses her/his direction. The person
continues until she/he reaches corner 4, which is a bar, or corner 0, which is
a home. If the person reaches either home or the bar, she/he stays there. Here
is a graphical representation of the problem.
1. You will need a coin or other method of simulating an
event with a probability 1/2. Pick a starting point 1, 2, or 3. Toss a coin. If
the coin shows head move to the right, if it is tail move to the left. Continue
tossing the coin until you reach to the bar or the home.
For
example, if you get the following sequence and start at 1: H H T H T
Your position at each step
will be: 2 3 2 3 2.
Since
you could not reach the bar of the home you should continue tossing the coin.
2. a. Starting from 1, repeat the above experiment 10
times, fill out the following table, and record the number of times you ended
up home and bar.
|
Coin Toss Sequence
|
Position
|
Destination
|
|
H
H T H T T T
|
2
3 2 3 2 1 0
|
Home
|
|
|
|
|
|
|
|
|
|
|
|
|
|
|
|
|
|
|
|
|
|
|
|
|
|
|
|
|
|
|
|
|
|
|
|
|
|
|
|
|
|
Total Number of homes
|
|
|
b. Starting from 2, repeat the above experiment 10
times, fill out the following table, and record the number of times you ended
up home and bar.
|
Coin Toss Sequence
|
Position
|
Destination
|
|
H
H T H T T T
|
3444444
|
Bar
|
|
|
|
|
|
|
|
|
|
|
|
|
|
|
|
|
|
|
|
|
|
|
|
|
|
|
|
|
|
|
|
|
|
|
|
|
|
|
|
|
|
Total Number of homes
|
|
|
c. Estimate you chance of reaching home starting from 1
by using the results of the experiments? What about your chance of reaching the
bar?
Estimate
you chance of reaching home starting from 2 by using the results of the
experiments? What about your chance of reaching the bar?
Compare
your results and justify why these estimates are different.
Connections
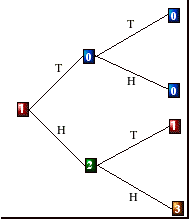
3. Tree Diagrams
a. Consider the following tree which represents all
possible outcomes of tossing a coin 4 times. Follow the individual branches and
determine where the drunk person will be if she/he starts at 3.
b. Since, if the drunk person reaches either home or the
bar, she/he stays there, eliminate the unnecessary branches of the tree diagram
given above.
c. Is it possible that starting from block 3 this drunk
person will never be able to reach home or the bar? Give an example.
4. From
Trees to Matrices
As
you can see representing this problem in a compact form by using the trees is
difficult. You have to be able to produce tree diagrams with infinite number of
branches for each starting point. Now let us search for a better way of
summarizing this problem.
a. Suppose that we saw this person at one of the blocks,
the person had enough time to take only one step. Where this person will be
when we come back? What are the factors that will affect your answer?
b.
c. Fill out the following table cross out the impossible
steps, for the remaining ones put down the corresponding outcome of the coin
toss experiment.
|
Future Position (Position after one step)
|
|
|
Present
Position
|
0
|
1
|
2
|
3
|
4
|
|
0
|
|
|
|
|
|
|
1
|
|
|
|
|
|
|
2
|
|
|
|
|
|
|
3
|
|
|
|
|
|
|
4
|
|
|
|
|
|
|
|
|
|
|
|
|
Replace corresponding outcomes of the experiment with
the probability that matches. Now, we can represent the table of probabilities
in a compact form as follows:
Interpret
this matrix by referring
to the table in c. This matrix is called one-step transition matrix. The states 0 and 4 are impossible to leave such
states are called absorbing states. States
which are not absorbing called transient.
Reaction and Reflection
5. Markov Property
Suppose
that the drunk person was in block 1, then 2, then 1, then 2 and now the person
is in block 3. You want to know where the person will be after the next step.
Do you need to know that the person was in corners 1, 2, 1, 2, to determine
where the person will be after visiting block 3?
Suppose
that the present the person is in block 3, does it make any difference if this
is the persons first, second, or tenth visit of block 3, to determine where the
person will be after the next step?
6. What will Happen After Two or More Steps?
Suppose
that the drunk person was in block 1, where this person could be after two steps?
Construct a tree diagram to show possibilities. As an example we have given
below a tree diagram when the drunk person was in block 1.
Fill
out the following table cross out the impossible steps, for the remaining ones
put down the corresponding outcome of the coin toss experiment. Note that this
time we have to toss the coin two times.
|
Position after two
step
|
|
|
Present
Position
|
0
|
1
|
2
|
3
|
4
|
|
0
|
|
|
|
|
|
|
1
|
|
|
|
|
|
|
2
|
TT
|
-
|
TH or HT
|
-
|
HH
|
|
3
|
|
|
|
|
|
|
4
|
|
|
|
|
|
|
|
|
|
|
|
|
Replace corresponding outcomes of the experiment with
the probability that matches. Now, we can represent the table of probabilities
in a compact form as follows:
Interpret
this matrix which is called two-step transition
matrix. Verify that
In
fact if you want to know what will happen probabilistically after n steps,
n-step transition matrix will be:

By
using a calculator or MINITAB find the 4-step transition matrix and interpret.
MTB >
read c1-c5
DATA> 1 0 0 0 0
DATA> 0.5 0 0.5 0 0
DATA> 0 0.5 0 0.5 0
DATA> 0 0 0.5 0 0.5
DATA> 0 0 0 0 1
DATA> end
5 ROWS
READ
MTB > copy c1-c5 m1
MTB > print m1
MATRIX M1
1.0 0.0
0.0 0.0 0.0
0.5 0.0
0.5 0.0 0.0
0.0 0.5
0.0 0.5 0.0
0.0 0.0
0.5 0.0 0.5
0.0 0.0
0.0 0.0 1.0
MTB > multiply m1 m1 m2
MTB > print m2
MATRIX M2
1.00 0.00
0.00 0.00 0.00
0.50 0.25
0.00 0.25 0.00
0.25 0.00
0.50 0.00 0.25
0.00 0.25
0.00 0.25 0.50
0.00 0.00
0.00 0.00 1.00
MTB >
multiply m1 m2 m3
MTB > print m3
MATRIX M3
1.000 0.000
0.000 0.000 0.000
0.625 0.000
0.250 0.000 0.125
0.250 0.250
0.000 0.250 0.250
0.125 0.000
0.250 0.000 0.625
0.000 0.000
0.000 0.000 1.000
MTB >
multiply m1 m3 m4
MTB > print m4
MATRIX M4
1.000 0.000
0.000 0.000 0.000
0.625 0.125
0.000 0.125 0.125
0.375 0.000
0.250 0.000 0.375
0.125 0.125
0.000 0.125 0.625
0.000 0.000
0.000 0.000 1.000
Ongoing Assessment and Wrap-up
7. Discuss the implications of Markov
Properties. List down possible tools that can be used to model a problem. Which
one of these tools is the most powerful in your opinion? Why?
8. Give some examples where this
process can be used in the real world.
Extensions
9. (Forecasting
the weather) The chance
of rain tomorrow depend on only today’s whether. If it rains today, then it
will rain tomorrow with probability 0.7 and if it does not rain today then it
will rain tomorrow with probability 0.4. Form the one-step transition matrix.
Find
the two-step transition probability matrix. What is the probability that it
will rain two days from today given that it is remaining today?
Find
the four-step transition probability matrix and interpret. Did you notice any
interesting pattern in probabilities?
Answers:

10. (War
of long distance companies) It has been observed that customers switch from one long
distance company to another according to the following transition matrix.
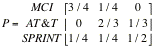
Find
the two-step transition matrix and interpret one and two-step transition
matrices. Find the probability that a customer who uses MCI today will again be
using MCI two months from today, assuming that she or he switches once a month.


Find
the twelve step transition matrix. Interpret the matrix.
Answer:
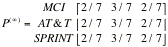
11. (Gossip
spreading) If a
member of a community is entrusted with some news, she/he will tell it to
her/his friends truly and without any changes with probability p. The
probability that she/he will twist it around and tell the opposite is really
negligible, say,  . The probability of such a misconduct and misbehavior is
less than one in a billion. Therefore, if a member of the community receives
news, she/he will tell it to another member truly and unchanged with
probability p,
and she/he will twist it and tell its opposite with probability
. The probability of such a misconduct and misbehavior is
less than one in a billion. Therefore, if a member of the community receives
news, she/he will tell it to another member truly and unchanged with
probability p,
and she/he will twist it and tell its opposite with probability  . Let
. Let
T= “the true statement about the young person’s dog”
N= “the negation of the true statement about the person’s
dog”.
Construct the one-step transition matrix. Interpret the
matrix. Find ten, twenty, one hundred-step transition probability matrices. Do
you see anything interesting? How are the probabilities changing? Can you say
that in general in this community only half of the people is telling the truth?
12. Visit the Mouse in a Maze example
and place the cat so that the chance that the mouse will end up with cheese
will be lower than the cat catching the mouse.
I.7. A Markov Chain
Activity

MARKOV CHAINS
Objective: To learn how to set up probability transition matrix
and construct an appropriate state diagram.
Activity:
1. Consider a farmer using an old tractor. The tractor
is often in the repair shop but it always takes only one day to get it running
again. The first day out of the shop it always works but on any given day
thereafter, independently of its previous history, there is a 10% chance of it
not working and thus being sent back to the shop.
Let X0, X1,
... be random variables denoting the daily condition of the tractor, where a
one denotes the working condition and a zero denotes the failed condition.
Explain in words
“Xn=1”®
“Xn=0”®
Write one step transition
probability matrix
P= 
Here is the state diagram
for this Markov chain:

2. A salesperson lives in town a and is responsible for towns a, b, and c. Each week he is required to visit a different town.
When s/he is in her/his home town, it makes no difference which town s/he
visits next so s/he flips a coin and if it heads s/he goes to b and if tails s/he goes to c. However, after spending a week away from home s/he
has a slight preference for going home so when s/he is in ether towns b or c
s/he flips two coins. If two heads occur, then s/he goes to the other town;
otherwise s/he goes to a.
Define
X0=
X1=
X16=
Explain in words
“Xn=a”®
“Xn=b”®
“Xn=c”®
Write one step transition
probability matrix
P= 
Construct a state diagram
for this Markov chain:
3. Let {Xn; n=0, 1, ...} be a Markov chain
with state space {1, 2, 3, 4} and transition probabilities given by
P= 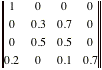
Construct a state diagram
for this Markov chain:
Starting from state 4 is it
possible not to come back state 4 again? Give an example.
What happens if you start
with state 1.
4. This example illustrates that the n need not refer to time. Consider a page of text and
represent vowels by zeroes and consonants by ones. Thus the page becomes a
string of zeros and ones. It has been indicated that the sequence of vowels and
consonants in the Samoan language forms a Markov chain, where a vowel always
follows a consonant and a vowel follows another vowel with a probability of
0.51.
Write one step transition
probability matrix
P= 
ASSESSMENT
Each morning an individual
leaves her house and goes for a run. She is equally likely to leave either from
her front or back door. Upon leaving the house, she chooses a pair of running
shoes (or goes running barefoot if there are no shoes at the door from which
she departed). On her return she is equally likely to enter, and leave her
running shoes, either by the front or back door. Suppose that she owns a total
of 5 pairs of running shoes.
Let Xn denote the number of
pairs of shoes at the door the runner departs from at the beginning of day n.
Write one step transition
probability matrix
P= 
II. Chapter 2
Random Variables
II.1. Review
For
this chapter we need to know some mathematical facts on the functions. These
facts will help us to understand the properties of the probabilistic models
that we are going to develop. A function f from a set D to a set E is a correspondence that assigns to each
element of D a unique element of
E.
Exercise 1. Suppose that coin tossed three times, leading to a
sample space S={HHH,HTT,THT,TTH,THH,HTH,HHT,TTT}. Define X=Number of heads
observed when we tossed a coin three times. Is X a function? If yes, what is D
and E?
Discrete Mathematics
To
be able to understand and derive the properties of the discrete probabilistic
models we need the following facts from discrete mathematics.
Binomial Theorem;: The quantity (a+b)can be expressed in the form
(a+b)= ,
where
= ; i=0 , ..., n.
For
example, we have
(a+b)= 1
(a+b)= a+b
(a+b)= a+2ab+b
(a+b)= a+3ab+3ab+b.
Note:
In probability we will use binomial theorem not to extend (a+b)but to evaluate the sums of the form . For example can you figure out the value of the
following sum?
What
about the following sum?
|
= ? =
Maybe
we should look for a better way of evaluating this sum?
|
Geometric Series;:
Let
a≠0.
= a+ar+ar+ar+...+ar+...
is
called geometric series which
(i) converges and has the sum if |r|<1.
(ii)
diverges if |r|≥1.
In
probability geometric series is used in a discrete distribution which is called
geometric distribution. Can you find the value of the following sum?
|
= ? =
Note
that the lower limit of the sum starts from 1 not 0 as in the geometric
series. Maybe we should define i=n-1. Then, what is a=?= , r=?=
|
Maclaurin Series;:
One
of the Maclaurian series that is used in the probability is the following
e= = 1+ a + + + ... .
By
using the Maclaurian series can you find the value of the following sum?
|
 e= ? = e= ? =
|
What
about the following sum which is used to find expected value of a Poisson
random variable.
|
 i e= ? = i e= ? =
Note
that = , so take one of the lout of the summation and ...
|
The Derivative of a Function:
One
way of understanding the behavior of a function f(x), is to look at its
derivative. With each function f(x) we associate another
function, called "the derivative of f(x)". This derivative is a
formula for the rate at which f(x) is changing as x changes, and it measures
the steepness of the graph of f(x). Here are the some of the formulas for the
derivatives that you should know(g(x) and h(x) are differentiable functions and
a, and b are arbitrary constants):
|
function
f(x)
|
its
derivative
f=
|
|
ax+b
|
a
|
|
ax+b
|
nax
|
|
e+b
|
ae
|
|
e+b
|
-ae
|
|
e+b
|
ge
|
|
aln(x)+b
|
|
|
h(x)g(x)
|
hg(x)+h(x)g
|
|
|
|
Table
1. Table of Derivatives for Some
Functions.
A
derivative of an integral as a function of its limit of integration can be
found by using the following relation (f(x) is a "nicely behaved"
function)
= f(x).
Derivatives of the Composite Functions: The Chain Rule
If
f=f(u) is a function of input variable u and u=u(x) is a function of the input
variable x, then
f(u(x)) = .
This
rule is useful in finding derivatives of functions with a complicated
relationship.
Exercise
2. Find the derivatives of the
following functions
(a) F(x)=1 - le
(b) M(t)=
(c)
M(t)=
(d) F(x) = dz.
The Definite Integral of a Function over an Interval: The definite integral of a
function over an interval, say a≤x≤b, of x-values, is a number which measures
the amount of f(x) aggregated in that interval.
Facts:
(i) If f(a) exists, then = 0.
(ii)
If f is integrable and f(x)≥0 for
every x in [a,b], then the area A of the region under the graph of f from a to
b is
A = .
(iii) For a < c < b
= +
(iv)
If f(x)≥0 and integrable on [a,b],
then
≥ 0.
Antidifferentiation;
is the reverse process to differentiation, that is antidifferentiation is the
process of finding a formula for a quantity if you its rate of change. The
process of antidifferentiation is commonly called integration or indefinite integration. The absence of the values bounding x at the top and
bottom of the integration symbol indicate that it calls for antiderivative and
not the definite integral.
|
= uv -
|
|
= u+ C, n≠-1
|
|
= ln|u| + C
|
|
du = e+ C
|
|
= a+ C
|
|
= tan+ C
|
|
= ln + C
|
|
= ln + C
|
Table
2. Table of Integrals
Evaluation of the Indefinite Integrals;:
By reversing the table of
derivatives (Table.1), we obtain a list of antiderivatives of many basic types
of functions. More complicated functions need to be re-expressed in a simpler
form by algebraic manipulations or substitutions.
Evaluation of the definite integral by using
antiderivatives; can be done by taking the difference in the values of
an antiderivative of f(x) (if one can be determined) at x=b and x=a.
That is
= F(x)F(b) - F(a)
where,
F(x) = .
Note
that for the definite integral the constant in the antiderivative disappears.
The Three Elementary Methods of
Integration;. Given an integral to evaluate whose formula is not
in the table of integrals: what to do? Often we can obtain the result we seek
by using one of the three elementary methods of integration from the calculus.
Do you remember them? 1) Ask your room-mate; 2) ask the instructor; and 3) look
it up. That is only partly facetious. There are extensive tables of integrals
in the CRC-Handbook and in other sources, and "Mathematica" is
a powerful piece of computer software that will readily evaluate integrals far
more difficult than anything that we are likely to encounter. Nonetheless, the
three elementary methods are useful tools with which we should be familiar.
They are 1) integration by substitution; 2) integration by parts; and 3)
integration by partial fractions. In this course we will mostly use the first
two methods which are explained below.
Integration by Substitution;.
Indefinite Integral
I will explain the method for the following trivial
integral,
Step 1. Find
a u=u(x) such that when we plug in u the unfamiliar integral will transform
into one we recognize.
Step 2.
Find the relation between dx and du, and replace former by the later.
Step 3.
Find the integral (antiderivative) of the recognizable form.
Step 4.
Plug in u(x) in your result.
|
We know that = ln|u| + C, so reasonable choice for
(recognize u(x))
u(x) = 3x+5, and
(relation between dx and du)
du=3dx
Þ dx= du
(replace former by the later, and find
antiderivative)
du = = ln|u| + C
(put back u(x))
= ln|3x+5| + C
|
Definite Integral
I will explain the method for the following trivial
integral,
Step 1. Find
a u=u(x) such that when we plug in u the unfamiliar integral will transform
into one we recognize.
Step 2.
Find the relation between dx and du, and replace former by the later.
Step 3.
Find the new limits in terms of u.
Step 4.
Find the integral (antiderivative) of the recognizable form.
Step 5.
Find the value of the definite integral.
|
We know that = ln|u| + C, so reasonable choice for
(recognize u(x))
u(x) = 3x+5, and
(relation between dx and du)
du=3dx
Þ dx= du
(replace former by the later, find new limits,
and find antiderivative)
=
du = = {ln11 - ln5} = ln
|
Integration by Parts;.
(Attention: This is the method that we are going
to use most frequently)
This method is based on the simple rule for finding
the differential of a product:
d(uv)
= vdu + udv
Rearranging and integrating,
= uv -
it being understood that if these are not definite
integrals, we must add an integration constant. We are initially stumped by the
integral on the left, but in our mind's eye we see a way to rearrange the
integral into two parts such that we can evaluate the integral on the right.
Here is an example and the steps that you need for
this method:
|
integral
|
dx
|
|
define u and dv
|
u=x and dv=edx
(Note that we know how to find the
antiderivative of dv)
|
|
find du and v
|
du=1dx and v== e
|
|
plug in u, du, v, and dv into the formula for
integration by parts
= uv -
|
dx = xe- dx
|
|
and the result
|
dx = xe- e+ C
|
For some problems it is necessary to repeatedly use
integration by parts. For such type of problems it is more useful to produce
reduction formulae. For example using integration by parts we can establish
that
This formula can be used repeatedly until all powers
of x have been removed.
Some Results Involving Limits
In this section, we simply remind you of some of the
techniques on the calculations of the limits that we find most useful in
probability theory. These techniques will be useful on understanding Central
Limit Theorem, and finding moments by using moment generating functions.
Early in a calculus course the existence of the
following limit is discussed and is denoted by the letter e:
|
e = lim = lim = lim
|
Often it is rather easy to see the value of certain
limits. For example, with -1 < r < 1, the sum of the geometric
progression allows us to write
lim = lim
= lim = .
= .
Since limr= 0, the limit of the ratio can be easily found.
However it is not that easy to determine the limit of
every ratio; for example consider
lim = lim
= lim .
.
Since both the numerator and the denominator of the
latter ratio are unbounded, we will not be able to find the limit easily.
Consider the ratio f(x)/g(x), if the limits of f(x)
and g(x) have the limits ∞ or -∞ as x approaches to c, we say
that f(x)/g(x) has the indeterminate form ∞/∞ at x=c. If the limits of both functions approaches to 0, then we say that
f(x)/g(x) has the indeterminate form 0/0 at x=c. L'Hospital's Rule can be
applied to the indeterminate forms to find the limit of the ratio.
|
L'Hopital's Rule: Suppose
the functions f and g are differentiable on an open interval (a,b) containing
c, except possibly at c itself. If g'(x) ≠ 0 for x ≠ c, and if f(x)/g(x) has
the intermediate form 0/0 or ∞/∞ at x=c, then
lim= lim
provided that lim[f'(x)/g'(x)] exists or lim[f'(x)/g'(x)] = ∞.
|
Therefore, limcan be found taking the limit of the ratio of the
derivative of the numerator and the derivative of the denominator. We have
lim= lim= 0.
Note that you can use L'Hopital's rule more than
once.
Some Results Involving
Multivariate Calculus
In this section we only make some suggestions about
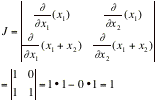
functions of two variables, say
z = g(x
But these results can be extended to more than two
variables. Usually all the results that we have learned for the one variable
case can be used for the two variable case by treating the "other"
variable as a constant. The two first partial derivatives;
with respect to x and y, denoted by and can be found in the usual manner of differentiating
by treating the "other" variable constant. For illustration consider
the following simple examples,
z = f(x,y) = xy
= = = y
and
= = (e)(2xy).
The second partial derivatives are
simply first partial derivatives of the first partial derivatives. If z=xy,
then
= = 1.
For notation we use
= ,
= ,
= ,
= .
In general,
= ,
provided that partial derivatives involved are
continuous functions.
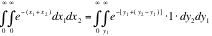
The value of the double integral

can usually be evaluated by an iterated procedure;
that is, evaluating two successive single integrals. For illustration, say A =
{(x,y): 0 ≤ x ≤ 1, 0 ≤ y ≤ x}.
Then
When placing the limits on the iterated integral, note that for each fixed x between zero and one, y
is restricted to the interval zero to x (see the figure below). Also in the
inner integral on y, x is treated as a constant.
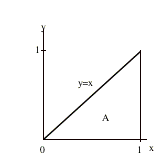
In evaluating this double integral we could have
restricted y to the interval zero to one, then x would be between y and one.
That is, we would have evaluated the iterated integral

Finally, we will look at change of variables in a
double integral

If f(x,x) is a joint probability density function of Xand X, then the above double integral represents P[(X,X)ÎA]. Consider only one-to-one transformations, say y=gand y=gwith inverse transformations given by x=hand x=h. The determinant of order 2
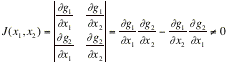
is called the Jacobian of the transformation;.
And
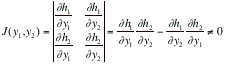
is called the Jacobian of the inverse transformation.
Moreover, say the region A maps onto B in the (y,y) space. Since we are usually dealing with
probabilities in this course, we fixed the sign of the integral so that it is
positive by using the absolute value of the Jacobian. Then it is true that
That is P[(X,X)ÎA] = P[(Y,Y)ÎB].
Note that |J(y,y)| = |J(x,x)|, but the right side is often easy to obtain,
rather than solving for xand xin terms of yand yor differentiating implicitly.
Now, let us look at the steps required for the
multivariate change of variables on the integration.
|
f(x,x)
|

|
|
DETERMINE THE REGION A
|

|
|
DETERMINE gAND g
|

|
|
DETERMINE hAND h
|

|
|
DETERMINE THE REGION B
|

|
|
FIND THE JACOBIAN, J
|
|
|
FIND THE ABSOLUTE VALUE OF THE JACOBIAN, |J|
|


|
|
WRITE DOWN THE TRANSFORMED INTEGRAL
|
|
Some Special Functions
Note that our objective is to develop probabilistic
models for the characteristic that we are interested with, such as survival
time of a cancer patient, life time of a TV set, or simply the midterm exam
scores of Math. 3610 students. Since the behavior of all the functions are not
the same the functional form of the model will characterize the random variable
differently. We will discuss this in detail in the next section. Now let us
look at some special functions and their properties.
|
Exponential Function
The function f(x)=eis called exponential function (frequently written exp(x)).
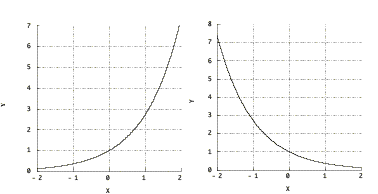
Figure 1. Graphs of eand e.
Note that e=1 and e=0.
ee=e
(e)=e
|
|
Gamma Function
The gamma function, denoted by G(a) for all a>0, is given by
G(a) =
The gamma function satisfies the following
properties:
G(a) = (a-1)G(a-1) a>1
G(n) = (n-1)! = (n-1)(n-2)...(1)
n = 1, 2, ...
(remember that O!=1 so G(1)=1)
G( ) = .
|
|
Beta Function
For a>0 and b>0, the beta function is given by
beta(a,b) =
The beta function has the following properties:
beta(a,b) =
beta(a,b) =
beta(b,a)
|
Exercise 3.
The following type of problems which involves
integration in distribution theory to develop probabilistic models:
(a)
Find the value of k such that
= 1.
Answer: k>0.
(b)
Find the value of c such that
= 1.
Answer: c=12.
(c)
Find the value of c such that
= 1.
Hint: Use the definition of the beta function.
Answer: 20.
The following integrals arises in finding distribution
functions given
probability density functions.
(d)
Find the value of the following integral
F(x) = .
(F(x) is called cumulative distribution function.)
Answer: 1-x; 1<x<¥.
(e) Find
the value of the following integral
F(x) = .
Answer: 1 - e; x>0.
The following integrals arises when we want to
find expected values.
(f)
Find the value of the following integral
E(X) = .
(The value of this integral is known as the first
moment or expected value of X)
Answer: .
(g) Find
the value of the integral
E(X) = .
Answer: .
The following type of integrals arises when we
want to find the moment generating functions.
(h)
Evaluate the following integral
f= ; l>0
(fis called moment generating function of
exponential distribution with
parameter l.)
Answer: .
(i) Evaluate
the following integral
f= .
(fis the moment generating function of a uniform random
variable over the
interval (a,b)).
Answer: .
(j)
Find the derivative of the fin (i) with respect to t.
Answer:
(k)
Find ffor (j).
(l) Let
y=x-xand y=x+x. Find J(x,x)=J, and J(y,y)
Answer: J(y,y)=1/2, J(x,x)=2
References
Agresti, A. Categorical
Data Analysis, John Wiley & Sons, 1990
Christensen, H. B.,
Introduction to Statistics, HBJ, 1992
Dudewicz, E. J., and Mishra,
S. N., Modern Mathematical Statistics, John Wiley & Sons, 1988
Engelhardt, B., Introduction
to Probability and Mathematical Statistics, PWS-KENT Publishing Company,
1992
Hogg, R.V., and Tanis, E.
A., Probability and Statistical Inference, MacMillan Publishing Company,
1993
Mendenhall, W., Wackerly, D.
D., and Scheaffer, Mathematical Statistics with Applications, PWS-KENT,
1990
Sceaffer, R. L., Introduction
to Probability, PWS-KENT, 1990