![]()
|
STAT. 3611 |
|
|
SPRING 2011 |
|
|
COURSE WEB SITE |
|
|
# OF CREDITS : |
4 |
|
PREREQUISITE: |
Stat. 1601 or 2601 or 2611 or # |
|
DAYS & TIME: |
TTH 2:00-3:40 |
|
BUILDING & ROOM: |
SCI. 3550 |
|
INSTRUCTOR: |
Dr. Engin
A. Sungur |
|
OFFICE: |
1350
SCIENCE |
|
TELEPHONE: |
x6325 |
|
OFFICE HOURS: |
MTWThF,
11:00-noon |
|
E-Mail |
sungurea@mrs.umn.edu |
COURSE DESCRIPTION: Analysis of categorical data. Loglinear models for
two- and higher-dimensional contingency tables. Logistic regression models.
Aspects of multivariate analysis, random vectors, sample geometry and random
sampling, multivariate normal distribution, inferences about the mean vector,
MANOVA. Analysis of covariance
structures: principal components, factor analysis. Classification and grouping
techniques: discrimination and classification, clustering, use of statistical
computer packages.
1. To
understand the main features of multivariate data.
2. To
be able to use exploratory and confirmatory multivariate statistical methods
properly.
3. To
be able to carry out multivariate statistical techniques and methods
efficiently and effectively.
EXPECTED OUTCOMES OF THE COURSE:
· (DATA
MINING) Explore and summarize multivariate data using graphical and numerical
methods and techniques to uncover hidden information and patterns.
· Describe
properties of multivariate distributions such as multivariate normal.
· Use
principal component analysis effectively for data exploration and data
dimension reduction.
· Use factor
analysis effectively for exploratory and confirmatory data analysis.
· Discriminate
between groups and classify new observations.
· Find
groupings and associations using cluster and correspondence analysis.
· Use of
statistical software packages effectively and efficiently.
PROJECT/SERVICE LEARNING EXPECTED OUTCOMES:
· Sharpen
students statistical intuition and abstract reasoning as well as their
reasoning from numerical data through community-based and other research.
· Enhance
students’ critical thinking in domains involving judgments based on data and
stimulate the type of independent thinking requiring research beyond the
confines of the textbook, through service learning projects, interdisciplinary
examples and exercises.
· Empower
students abilities to see and communicate statistical ideas effectively through
written and oral presentations to research partners (community partners)
STATISTICAL COMPUTING: In
multivariate statistical analysis, as in statistical analysis as a whole, the
computer is a valuable computational tool. There are many statistical packages
are available for multivariate statistical analysis. The main software that we
are going to use is R. We will also use SAS and SYSTAT time to time. The
detailed instructions on the software use are provided in the statistical
computing section of the course website.
COURSE WEB SITE: Extensive lecture notes, concept maps, links, and other course materials
are available on the course open and Moodle websites. Instructions will be
given in class regarding access to these materials. The sites
include general information about the course, activities and links to the other
sites related with the statistics. Students are encouraged to visit these sites
regularly and make suggestions to the instructor for improvement. The course
open site is located at http://mnstats.morris.umn.edu//multivariatestatistics/.
COURSE MATERIAL: Brian S.
Everitt and Graham Dunn, Applied Multivariate Analysis, Second edition, Arnold
press, 2001
EXAMINATION POLICY: One midterm
examinations and a final exam will be given. Time table and procedure for the
examinations is given below:
|
MIDTERM EXAM IN-CLASS ONLINE |
MARCH 10(Thursday) MARCH 3-11 |
SCI. 3550 |
2:00 pm-3:40 pm |
|
FINAL |
MAY 12(Thursday) |
SCI. 3550 |
4:00-6:00
pm |
EACH EXAMINATION (INCLUDING THE FINAL) WILL HAVE A TAKE HOME PART.
|
HOMEWORKS: Several
homeworks will be assigned. Your work will be graded on both technical skills
and ability to communicate the findings. Homework
assignments will be given that correspond to each chapter in the text. Due
dates will be posted for each assignment on the Moodle course site. Late homework
will be penalized 50% of the point value. Students need to download the
assignment MS Word template from the course website, type their answers and
insert related graphs. All homework assignments
are expected to be completed with a word processor in electronic form. The
assignments should be uploaded in Moodle course website. Email submissions to
the instructor will not be accepted. |
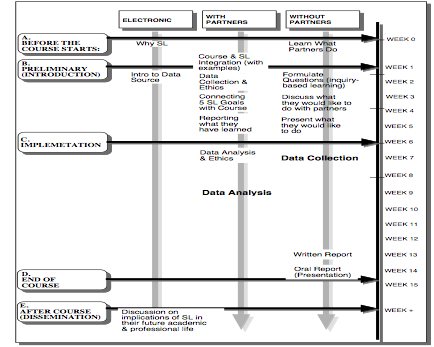
COURSE PROJECT:
ALTERNATIVE
1: COMMUNITY-BASED RESEARCH PROJECT: To achieve the course objectives,
the students will work on a community-related issue. They will meet with
community partner, formulate relevant statistical questions, produce that,
assess the reliability of the data, carry out exploratory and confirmatory
analyses of the data, interpret the results in the context of the problem and
discuss the implications of their findings for the community based on various
domains (economical, social, political etc.). The time-table of the project
given below:
ALTERNATIVE 2:
DUE DATES:
· Let
instructor know about the members of your group by March 23, 2011. Each
group should have 2-3 members
· Reports for
research (3-4 pages) and data analysis (3-4 pages) are due on May 4, 2011
· Presentations
are going to take place within the last two weeks of the semester as follows:
|
Group |
Group
Members |
Date |
Time |
|
1 |
|
April 21, 2011 |
2:00-3:40 |
|
2 |
|
April 21, 2011 |
2:00-3:40 |
|
3 |
|
April 26, 2011 |
2:00-3:40 |
|
4 |
|
April 26, 2011 |
2:00-3:40 |
|
5 |
|
April 28, 2011 |
2:00-3:40 |
|
6 |
|
April 28, 2011 |
2:00-3:40 |
|
7 |
|
May 3, 2011 |
2:00-3:40 |
|
8 |
|
May 3, 2011 |
2:00-3:40 |
|
9 |
|
May 5, 2011 |
2:00-3:40 |
|
10 |
|
May 5, 2011 |
2:00-3:40 |
Your course project will have two parts:
I. Presenting
a research in multivariate statistics.
II. Analyzing a
data set by using multivariate statistical methods.
I. PRESENTING A RESEARCH
· Select one
of the papers.
· Read and
understand the paper.
· Carry out a
literature search to understand the paper better.
· Write a
report (3-4 pages).
· Present
your findings to the class (Powerpoint etc.).
Your report and presentation
should avoid technical details and aim for the level of the students in class.
II.
ANALYZING A DATA SET
You have three options:
a. Select any
data set that you want.
b. Use the
civic engagement data set located at mnstats.morris.umn.edu//multivariatestatistics/civic.html
In your
report (3-4 pages) and presentation clearly state the following:
• Problem
(research question that has been addressed)
•
Background information on data
•
Statistical hypotheses and/or research questions
• Brief
explanations of the multivariate statistical technique/methods used
•
Discussion and comments on the results
Please note that interpretation and clear presentation of
the graphs will play crucial role on grading. Include only the part of software
output that you use for interpretation.
|
ASSIGNMENTS: |
40% |
|
PROJECT: |
10% |
|
MIDTERM
EXAM: |
25% |
|
FINAL
EXAM: |
25% |
|
A |
A- |
B+ |
B |
B- |
C+ |
C |
C- |
D+ |
D |
F |
|
90-100 |
88-89 |
86-87 |
80-85 |
78-79 |
76-77 |
70-75 |
68-69 |
66-67 |
60-65 |
0-59 |
S 68-100 N 0-67
COURSE OUTLINE:
|
PART I. EXPLORATORY MULTIVARIATE TECHNIQUES: “DATA MINING” |
||
|
1. Multivariate Data And Multivariate Statistics |
||
|
|
1.1
Introduction |
|
|
1.2
Types of Data |
nominal, ordinal, interval,
ratio missing observations |
|
|
1.3
Basic Multivariate Statistics |
mean, variance, covariance,
correlation |
|
|
1.4
The Aims of Multivariate Analysis |
data exploration, inference |
|
|
2. Exploring Multivariate Data Graphically |
||
|
|
2.1
Introduction |
|
|
2.2
The scatterplot |
|
|
|
2.3
Scatterplot Matrix |
|
|
|
2.4
Enhanced Scatterplots |
bubble plots, smoothing, density
estimates, bivariate boxplots |
|
|
2.5
Coplots and Trellis Graphics |
conditioning plots, dimension
reduced graphs |
|
|
2.6
Probability Plots |
Quantile and normal plots |
|
|
2.7
Other Plots |
3-D spin, Star plots, Chernoff
Faces |
|
|
3. Principal Components Analysis |
||
|
|
3.1
Introduction and Motivation |
data dimension reduction, linear
combination of variables |
|
3.2
Presentation of Method |
eigenvalues and vectors,
loadings, scores |
|
|
3.3
Extensions |
|
|
|
3.4
Graphical Methods |
biplots |
|
|
3.5
Applications and Examples |
|
|
|
4. Correspondence Analysis |
||
|
|
4.1
Introduction and Motivation |
categorical scatterplots and maps, |
|
4.2
A Simple Example |
|
|
|
4.3
Two-Dimensional Tables |
correspondence analysis |
|
|
4.4
Applications |
|
|
|
4.5
Multiple Correspondence Analysis |
|
|
|
5. Multidimensional
Scaling (MDS) |
||
|
|
5.1
Introduction and Motivation |
|
|
5.2
Proximity Matrices |
|
|
|
5.3
Classical MDS |
|
|
|
5.4
Metric LS MDS |
|
|
|
5.5
Non-metric MDS |
|
|
|
5.6
Non-Euclidean metrics |
|
|
|
5.7
Three-way MDS |
|
|
|
5.8
Inference in MDS |
|
|
|
6. Cluster Analysis |
||
|
|
6.1
Introduction and Motivation |
classification |
|
6.2
Agglomerative Hierarchical Clustering Techniques |
inter-cluster dissimilarity,
single linkage, complete linkage |
|
|
6.3
Optimization Methods |
total, within and between group
dispersion |
|
|
6.4
Finite Mixture Models for Cluster Analysis |
mixture distributions |
|
|
PART II. CONFIRMATORY MULTIVARIATE TECHNIQUES[1]:
“DATA CRAFTING” |
||
|
7. The
Generalized Linear Models (GLM) |
||
|
|
7.1
Linear Models |
|
|
7.2
Non-linear Models |
|
|
|
7.3
Link Functions, Error Distributions |
|
|
|
8. Regression
and MANOVA |
||
|
|
8.1
Introduction and Motivation |
|
|
8.2
LS Estimation and ANOVA models |
|
|
|
8.3
Direct and Indirect Effects |
path diagrams |
|
|
9. Log-Linear
and Logistic Models |
||
|
|
9.1
Introduction and Motivation |
categorical, binary response |
|
9.2
MLE |
sampling scheme, likelihood
function, model selection |
|
|
9.3
Transition Models |
longitudinal study, Markov
chains |
|
|
10. Multivariate
Response Models |
||
|
|
10.1
Introduction and Motivation |
multivariate response vs.
multivariate explanatory variables |
|
10.2
Repeated Measures |
|
|
|
10.3
Multivariate Tests |
|
|
|
10.4
Random
Effects |
|
|
|
10.5
Logistic Models |
binary response |
|
|
10.6
Marginal Models for Binary Response |
|
|
|
10.7
Marginal Modelling |
|
|
|
10.8
Generalized Random Effects |
|
|
|
11. Discrimination,
Classification, and Pattern Recognition |
||
|
|
11.1
Introduction and Motivation |
|
|
11.2
Example |
|
|
|
11.3
Allocation Rules |
|
|
|
11.4
Fisher’s Discriminant Function |
|
|
|
11.5
Assessing Discriminant Function |
|
|
|
11.6
Quadratic Discriminant Function |
|
|
|
11.7
More
than Two Groups |
|
|
|
11.8
Logistic Discrimination |
|
|
|
11.9
Variable Selection |
|
|
|
11.10
Other Methods |
|
|
|
11.11
Pattern Recognition, Neural Networks |
|
|
|
12. Exploratory Factor Analysis |
||
|
|
12.1
Introduction to Factor Analysis |
latent variable, |
|
12.2
Basic Factor Analysis Model |
factors, factor loadings,
communalities, factor scores |
|
|
12.3
Estimation of the FA Model |
|
|
|
12.4
Rotation of Factors |
|
|
|
12.5
Estimating Factor Scores |
|
|
|
12.6
Factor Analysis vs. PCA |
|
|
|
13. Confirmatory Factor Analysis and Structural Equations Models |
||
|
|
13.1
Introduction |
|
|
13.2
Path Analysis and Path Diagrams |
|
|
|
13.3
Structural Equations Models (SEM’s) |
|
|
|
13.4
Assessment of Fit |
|
|
GENERAL INFORMATION AND POLICIES: ORGANIZATION OF
IN-CLASS ACTIVITIES
The organization of the in-class
activities are summarized in the following flowchart. The main components of
the organization structure are:
(i) Summaries and Outline: These two components, hopefully,
will provide a smooth transition between the topics and lectures. These will
answer three basic questions: Where have we been?, Where are we going?, and
What have we learned?

(ii) Student Evaluators: Class
participation and discussion are very important on the learning process.
Students are encouraged to ask questions in the class. Questions, comments
could help the instructor to set up his/her pace. The input from the students
should be constant. If you point out the weaknesses of the instructor, and the
problems with the course in general as soon as possible your learning process
will be enhanced. To formalize and promote active learning, each in-class
activity will be evaluated by the two students. These students will be
responsible to point out all the problems that might affect the learning of the
rest of the class. For example, the topics that are not clearly covered, pace
of the lecture, use of the blackboard, problems with taking notes, etc. Time
to time student evaluators will be asked to make a summary of the
previous class.
DISABILITIES AND MENTAL HEALTH
As a
student you may experience a range of issues that can cause barriers to
learning, such as strained relationships, increased anxiety, alcohol/drug
problems, feeling down, difficulty concentrating and/or lack of
motivation. These mental health concerns or stressful events may lead to
diminished academic performance or reduce your ability to participate in daily
activities. University of Minnesota services are available to assist you
with addressing these and other concerns you may be experiencing. You can
learn more about the broad range of confidential mental health services
available on campus via www.mentalhealth.umn.edu.