
FOR INSTRUCTOR'S USE
1. a......./5 b....../5 c......./5
........../15
2. a......./7 b....../7 c......./6
........../20
3. a......./8 b....../7 ........../15
4. a......./6 b....../7 c......./6
d......./6 ........../25
5. a......./7 b....../6 c......./6
d......./6 ........../25
TOTAL ........../100
1. The following is the stemplot of the hourly earnings of the production workers for all 50 states and the District of Columbia. |
| 6 | 34 |
| 6 | 66679 |
| 7 | 01223333 |
| 7 | 559 |
| 8 | 233444 |
| 8 | 566666667778 |
| 9 | 1233334 |
| 9 | 78 |
| 10 | 000 |
| 10 | |
| 11 | 12 |
| 11 | 7 |
a. Interpret the stemplot. b. Find the range c. Find the median |
2. The infant mortality rate is the number of deaths of infants under 1 year old per 1000 live births in a given year. The following data shows 1993 infant mortality rates in selected countries of the world. |
| Country | Rate |
| Afghanistan | 162 |
| Australia | 7 |
| Austria | 9 |
| Belgium | 8 |
| Bangladesh | 108 |
| Cambodia | 116 |
| Canada | 7 |
| Costa Rica | 17 |
| Cuba | 13 |
| United States | 8 |
a. Give the five-number summary for this distribution. b. Construct a boxplot and interpret. c. Use the 1.5xIQR criterion to spot suspected outliers. |
3. A mathematics instructor studies the lengths of time required for students to complete the final examination. She found that the mean time was 90 minutes and the standard deviation 10 minutes. If the lengths of time are normally distributed. a. 95% of all lengths of time will fall between what two times? b. 99.7% of the students will complete the final examination between what two times? |
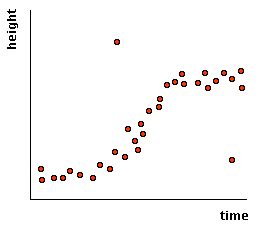
4. A 1995 Gallup poll, sponsored by the National Sleep Foundation, found that people in the United States were averaging 7 hours of sleep per night (The Chronicle of Higher Education, August 9, 1996). Assume that the amount of sleep per night for all people in the United States is normally distributed with a mean of 7 hours and a standard deviation of 1.2 hours. a. Find the proportion of people living in the United States who get 8 hours or more of sleep per night. b. Find the proportion of people living in the United States who get between 7.5 and 9 hours or more of sleep per night. c. The 10% of Americans who sleep the most get more than how many hours of sleep per night? d. The 5% of Americans who sleep the least get fewer than how many hours of sleep per night? |
5. A researcher took a sample of 10 years and found the following relationship between x and y where x is the number of major natural calamities (such as tornadoes, hurricanes, earthquakes, floods, etc.) that occurred during a year and y represents the average total profit (in millions of dollars) of all insurance companies in the United States. The least squares regression line is y=212.6-1.90x. a. Interpret 212.6 and -1.90 in the context of the problem. b. Given the above least squares regression, what would be the sign of the correlation coefficient r. Please justify your answer. c. A randomly selected year had 24 major calamities. What are the expected average profits of U.S. insurance companies for that year? d. Interpret the following scatter plot. |
