STATISTICAL
METHODS
INFORMATION
ON THE FIRST MIDTERM EXAMINATION
Date: September 21, 2011 (Wednesday)
Time: 9:15-10:20
Place: SCI. 3550
Examination Type: Closed notes and books. But you will be allowed
to use one sheet of paper (information sheet) with the formulas and facts that
you need (This sheet should not have solutions of problems or examples)
Coverage: Chapter 1-3
The important topics that you should know for the exam.
Chp. 1
Statistics
1.1 & 1.2. Definition
of statistics & Types of Statistical Applications
descriptive and inferential statistics
1.3. Elements of Statistics
population
variable
sample
statistical inference
reliability of the inference
1.4. Types of Data
Qualitative,
Quantitative; nominal, ordinal, interval, ratio data
1.5. Collecting Data
Chp. 2
Descriptive Statistics
2.1. Describing Qualitative Data
2.2. Graphical methods for quantitative data
Stem-and-leaf
displays and its interpretation
Histograms and
its interpretation
2.3 & 2.4 Measures of Central Tendency
sample mean and population mean (μ)
How to find
mean
How to find
median (position and depth of the median)
How to find mode (unimodal, bimodal,
multimodal).
2.5. Measures of variability
Why do we need
a measure of dispersion?
sample range
sample mean absolute deviation
sample variance
sample standard deviation( why do we need sample standard
deviation?)
2.6. Interpreting and Understanding standard deviation
Chebyshev's Theorem (for all distributions)
Emprical Rule (for normally distributed data)
(Given mean
and standard deviation find the proportion of observations between two values,
find
the limits given the percentages)
2.7. Measures of relative standing (position)
Percentiles
& Quartiles
z-scores (how to find z-scores, use of z-scores, interpretation
of z-scores)
2.8. Methods of Detecting Outliers, Boxplots
IQR= QU-QL
Construction
of the boxplots by using lowest value, lower
quartile, median, upper quartile,
highest value
Interpretation
of single and side-by-side boxplots
Chp. 3
Probability
3.1. Elements of Probability
experiment, simple event, sample space, event
steps for calculating event probabilities
3.2 & 3.4. Compound
events
unions and intersections
3.3. Complementary events (How to find the probability of a
complement of an event)
3.5. Conditional probability & the Bayes
rule
3.6. Probabilities of Unions and intersections
additive rule
multiplicative rule
mutually exclusive events & independent events (showing
whether two events are mutually
exclusive or independent and
given mutually exclusiveness and independents finding compound
event probabilities
3.7. Random Sampling
3.8. Some Counting Rules
STUDY
QUESTIONS
1.
Here is the number of home runs that Babe Ruth and Roger Maris hit during the
years that they were with the New York Yankees.
BABE RUTH
|
54 |
59 |
35 |
41 |
46 |
25 |
47 |
60 |
54 |
46 |
49 |
46 |
41 |
34 |
22 |
ROGER MARIS
|
8 |
13 |
14 |
16 |
23 |
26 |
28 |
33 |
39 |
61 |
Note that Ruth's record of 60 home runs in one season was broken by another
Yankee, Roger Maris, who hit 61 home runs in 1961.
a. What is the variable of interest? Is this data qualitative
or quantitative?
b.
Produce a back-to back stem-and-leaf display for the
home runs of Babe Ruth and Roger Maris and interpret. Who was superior
as a home run hitter?
c. Construct boxplot for the home
runs of Babe Ruth and interpret it.
2. a. A survey of local
companies found that the mean amount of travel allowance for executives was
$0.25 per mile. The standard deviation was $0.02. Using the Chepyshev's
theorem, find the minimum percentage of the data values that will fall between
$0.20 and $0.30.
b. The distribution of amounts spent per month for rent by
students attending Computer University is mound-shaped. The mean monthly rental
is $450, and the standard deviation is $125. approximately,
what percentage of rentals is between $75 and $825?
3. The security manager of a large building reports that the
probability is 0.05 that a fire alarm will not operate when needed. Suppose
that there are 3 alarms in the building, and whether one operates or not does
not affect the operation of others.
a. What is the probability that all of them will operate during
a particular fire?
b. What is the probability that at least 1 will operate during
a particular fire?
4.
At a large factory 89 employees were surveyed and classified according to their
level of education and whether or not they smoked. The data are shown in the
table.
|
|
Educational level |
||
|
Smoking Habits |
Not high school
graduate |
High school graduate |
College graduate |
|
Smoke |
6 |
14 |
19 |
|
Do not smoke |
18 |
7 |
25 |
A. If an employee is selected at random, find these
probabilities
a. the employee is a high school graduate and smokes
b. the employee smokes, given that s/he graduated from
college
c. given that the employee smokes, s/he is a college
graduate
B.
d. Are the events "smoke" and "not high school
graduate" independent? Please justify your answer.
5. A pregnancy test is 98% accurate in detecting pregnancy.
That is, if a woman is pregnant, it will show positive 98% of the time and show
negative 2% of the time. Furthermore, if a woman is not pregnant, it will show
negative 98% of the time and positive 2% of the time. Assume that there is a
50% probability that a woman who uses the test is pregnant.
a. Find the probability that the test will be negative.
b. Find the probability that if the test shows positive, the
woman is nor pregnant.
6. Consider the following system of components connected as in
the accompanying pictures. The probability of failure for components in the system is 0.1. Assume
components operate independently of each other.
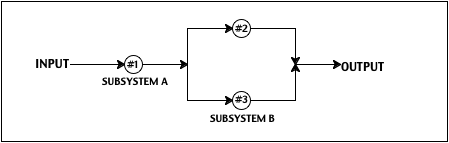
a. Find the probability that the system will fail
to operate properly.
b. Find the probability that at lease one of the subsystems
will fail.