UNIVERSITY OF MINNESOTA, MORRIS
INTRODUCTION TO STATISTICS
(GENED WEB)
MATH. 1601
SOLUTIONS TO THE PRACTICE TEST
1.
A study is conducted on the mean time it takes a person to find a new job. A sample of 36 job seekers was surveyed. For the sample the average time it took a person to find a job was 5.9 months. Suppose that population standard deviation is 0.8 months.a. Construct a 99% confidence interval for the population mean.
b. What should be the sample size required to estimate the mean with a margin of error 0.1 months at a 95% confidence level?
a.
![]()
b. ![]()
1. A customer's group sampled 49 different stores in the city and found that the average price of a particular model and brand of washing machine was $522.85 with a population standard deviation of $29.55.
a. Find a 95% confidence interval for the average price of this particular washing machine.
b. How many observations must be averaged to get a margin of error of $5 with 95% confidence?
a. ![]()
b. ![]()
2. In 1963, the Rev. Martin Luther King, Jr., gave his inspirational "I have a dream" speech, which established civil rights on the forefront of the nation's social agenda. Since that time, the United States has made strides toward racial equali ty. However, a Media General-Associated Press poll conducted 25 years later found that 55% of Americans still believe the American society is racist overall (Tampa Tribune, Aug. 8, 1988). The results were based on telephone interviews with a random ly selected sample of 1,223 adults across the nation. Find a 90% confidence interval for the true proportion of all Americans who believe that American society is racist overall.

2. The U.S. Food and Drug Administration (FDA) recently approved the marketing of a new chemical solution, Caridex, which dissolves cavities. In a study conducted by dental researchers at Northwestern University, 21 of the 35 patients with cavit ies preferred treatment with Caridex to drilling (Gainesville Sun, Feb. 11, 1988). Find a 90% confidence interval for the true proportion of dental patients who prefer having cavities dissolved with Caridex rather than drilled.

3. In 1895 an Italian criminologist, Cesare Lombroso, proposed that the blood pressure be used to test for truthfulness. In the 1930's, William Marston added the measurements of respiration and perspiration to the process, built a machine to do the measuring, and called his invention the polygraph- or lie-detector. Today, the federal court system will not consider polygraph results as evidence, but nearly half of the state courts do permit polygraph tests under certain circumstance s. In additioan, its use in screening job applicants is on the rise. Physicians Michael Philips, Alan Brett, and John Beary subjected the polygraph to the same careful testing given to medical diagnostic tests. They found that if 1,000 people were subject ed to the polygraph and 500 told the truth and 500 lied, the polygraph would indicate the approximately 185 of the truth-tellers were liars and that approximately 120 of the liars were truth-tellers ("Lie Detectors Can Make a Liar of You," Discover, June 1986).
a. In the application of a polygraph test, an individual is presumed to be truth-teller (H0 ) until "proven" a liar (Ha ). In this context, what is a Type I error? A Type II error?
b. According to Philips, Brett, and Beary, what is the probability (approximately) that a polygraph test will result in a Type I error? A Type II error?
a.
Type I Error="claiming that the person is liar when in fact s/he is a truth-teller"
Type II Error="claiming that the person is a truth-teller when in fact s/he is a liar"
b.
|
Decision |
State of Nature |
||
|
Truth-teller |
Liar |
||
|
Truth-teller |
315 |
120 |
435 |
|
Liar |
185 |
380 |
565 |
|
500 |
500 |
1000 |
|
P(Type I Error)=185/500=0.37
P(Type II Error)=120/500=0.24
4.
a. A health care professional wishes to estimate the birth weights of infants. How large a sample must she select if she desires to be 90% confident that the true mean is within 6 ounces of the sample mean? The standard deviation of the birth weigh ts is known to be 8 ounces.
b. A medical researcher wishes to determine the percentage of females who take vitamins. The researcher wishes to be 99% confident that the estimate is within 2 percentage points of the true proportion. How large should the sample size be?
a. ![]()
b. ![]()
5. An article in a recent medical journal pointed out that better nutrition has increased the mean weight of adult men in the United States to 175 pounds. The director of a weight control institute felt the figure was too high for the males in t he region served by her institute. A sample of 45 men yielded average weight of 168.7 pounds. Assume that the population standard deviation of the weight of the adult men in this region is 25.9 pounds.
a. State the null and alternative hypotheses.
b. Carry out the test and give the P-value. Report your conclusion.
c. Is the result significant at the 5% level (
a=0.05)?a. 
b. 
c. No.
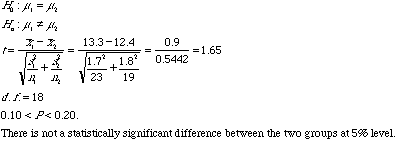
6. A study of iron deficiency among infants compared samples of infants following different feeding regimens. One group contained breast-fed infants, while the children in another group were fed a standard baby formula without any iron supplements. Here are summary results on blood hemoglobin levels at 12 months of age (American Journal of Clinical Nutrition).
|
GROUP |
n |
|
s |
|
Breast-fed |
23 |
13.3 |
1.7 |
|
Formula |
19 |
12.4 |
1.8 |
a.
Is there significant evidence that the mean hemoglobin level among breast-fed babies is different than the hemoglobin level among the babies who were fed formula? State H0 and Ha, Give the P-value. What is your conclusion?b. Give a 95% confidence interval for the mean difference in hemoglobin level between the two populations of infants.
a.

b.
![]()
7.
a. A magazine article stated that the average age of women who were getting divorced for the first time was less than 40 years. A researcher decided to test this theory at a= 0.025. She selected a sample of 20 women who were recently divorced and found that the average age was 38.6 years. The standard deviation of the sample was 4 years. Assume that the variable is approximately normally distributed. Should the null hypothesis be rejected on the basis of this sample?
b. A sample of 30 job seekers was surveyed. The study found that the average time it took a person to find a job was 5.9 months with a sample standard deviation of 0.8 months. Construct a 95% confidence interval for the mean.
a.

b.
![]()
8. A coin is thrown independently 10 times to test the hypothesis that the probability of heads is 1/2 versus the alternative that the probability is not 1/2. The test rejects if either 0 or 10 heads are observed.
a. What is the significance level of the test?
b. If in fact the probability of heads is 0.1, what is the power of the test?
a. P(Reject H0 when H0 is true)=P(getting 0 or 10 heads when probability of getting heads is 1/2)
(Binomial with n=10 and p=0.5)
P(Reject H0 when H0 is true)=P(X=0)+P(X=10)=0.001+0.001=0.002(from table C)
b. P(Reject H0 when p=0.1)=P(getting 0 or 10 heads when probability of getting heads is 0.1)
=P(X=0)+P(X=10)=0.3487+0.000=0.3487(from table C)
9.
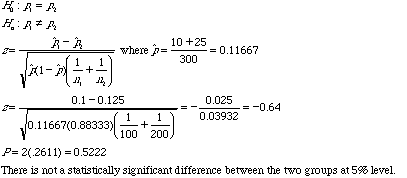
A noted medical researcher has suggested that a heart attack is less likely to occur among adults who actively participate in athletics. A random sample of 300 adults is obtained. Of that total, 100 are fo und to be athletically active. Within this group, 10 suffered heart attacks; among the 200 athletically in active adults, 25 had suffered heart attacks.a. Test the hypothesis that the proportion of adults who are active and suffered heart attacks is different than the proportion of adults who are not active and suffered heart attacks. Use the 0.05 significance level.
b. Construct a 99% confidence interval for the difference between the proportions of all active and inactive adults who suffered heart attacks.
a.

b.

10. Salaries in team sports have skyrocketed over the years and owners of major league baseball teams have had to increase ticket prices in order to meet payroll needs. Labor negotiations invariably get bogged down with discussions of average payro ll. The data below record the annual salaries and prorated signing bonuses (in millions of dollars) paid to each major league team's fourth-highest-salaried pitcher and third-highest-salaried outfielder.
a. At the 0.05 level of significance, is there evidence of a difference between American versus National League pitcher salaries?
ANSWER:
INDEPENDENT SAMPLES T-TEST ON PITCHERS GROUPED BY LEAGUE
GROUP N MEAN SD
1.000 14 1.642 0.972
2.000 14 1.471 0.988
SEPARATE VARIANCES t = 0.462 DF = 26.0 PROB = 0.648
POOLED VARIANCES t = 0.462 DF = 26 PROB = 0.648
There is no statistically significant difference.
b. At the 0.05 level of significance, is there evidence between pitcher and outfielder salaries in the American League?
ANSWER:
(Paired Test)
PAIRED SAMPLES T-TEST
MEAN DIFFERENCE = 0.557
SD DIFFERENCE = 0.811
t= 2.571 DF = 13 PROB = 0.023
Yes, there is statistically significant difference.
a. At the 0.05 level of significance, is there evidence of a difference between American versus National League outfielder salaries?
ANSWER:
INDEPENDENT SAMPLES T-TEST ON OUTFIELD GROUPED BY LEAGUE
GROUP N MEAN SD
1.000 14 1.085 0.872
2.000 14 1.624 1.525
SEPARATE VARIANCES t = -1.147 DF = 20.7 PROB = 0.264
POOLED VARIANCES t = -1.147 DF = 26 PROB = 0.262
There is no statistically significant difference.
b. At the 0.05 level of significance, is there evidence between pitcher and outfielder salaries in the National League?
ANSWER:
PAIRED SAMPLES T-TEST
MEAN DIFFERENCE = -0.153
SD DIFFERENCE = 1.641
t = -0.348 DF = 13 PROB = 0.733
There is no statistically significant difference.
|
American League |
|||
|
TEAM |
PITCHER |
OUTFIELDER |
|
|
Angels |
1.600 |
2.275 |
|
|
Orioles |
2.340 |
2.200 |
|
|
Red Sox |
1.126 |
1.100 |
|
|
Indians |
3.100 |
2.100 |
|
|
White Sox |
0.817 |
0.225 |
|
|
Tigers |
0.475 |
0.310 |
|
|
City Royals |
1.700 |
1.750 |
|
|
Brewers |
1.216 |
0.275 |
|
|
Twins |
0.450 |
0.260 |
|
|
Yankees |
2.325 |
2.355 |
|
|
A's |
0.240 |
0.165 |
|
|
Mariners |
2.300 |
0.750 |
|
|
Rangers |
2.000 |
0.375 |
|
|
Blue Jays |
3.300 |
1.050 |
|
|
National League |
|||
|
TEAM |
PITCHER |
OUTFIELDER |
|
|
Braves |
3.610 |
0.250 |
|
|
Cubs |
1.050 |
0.450 |
|
|
Reds |
2.100 |
0.190 |
|
|
Rockies |
1.200 |
4.000 |
|
|
Marlins |
2.900 |
4.500 |
|
|
Astros |
0.413 |
0.750 |
|
|
Dodgers |
1.600 |
1.733 |
|
|
Expos |
0.525 |
0.500 |
|
|
Mets |
1.100 |
0.212 |
|
|
Philies |
0.900 |
2.000 |
|
|
Pirates |
0.210 |
0.160 |
|
|
Cardinals |
1.750 |
3.300 |
|
|
Padres |
0.835 |
2.987 |
|
|
Giants |
2.400 |
1.700 |
|